在TeeChar系列教程中,上一章我们主要讲解了如何实现轴控制(中),今天我们继续为大家讲解实现轴控制的最后一部分。


TeeChart for .NET是优秀的工业4.0 WinForm图表控件,官方独家授权汉化,集功能全面、性能稳定、价格实惠等优势于一体。TeeChart for .NET 中文版还可让您在使用和学习上没有任何语言障碍,至少可以节省30%的开发时间。
TeeChart for .NET最新版下载
在TeeChar系列教程中,上一章我们主要讲解了如何实现轴控制(中),今天我们继续为大家讲解“实现轴控制的最后一部分”。
TeeChart for .NET技术交流QQ群: ,欢迎加入
对数标签
正常的对数标签可按以下方式设置。
[C#.Net] private void button1_Click(object sender, System.EventArgs e) Random rnd = new Random(); Steema.TeeChart.Axis leftAxis = tChart1.Axes.Left; tChart1.Aspect.View3D = false; bar1.Marks.Visible = false; for(int i = 0; i <= 100; ++i) bar1.Add(rnd.Next(100) * i); leftAxis.LogarithmicBase = 10; leftAxis.Logarithmic = true; leftAxis.SetMinMax(0, 10000); leftAxis.Labels.ValueFormat = "#e+0"; //exponential format [VB.Net] Private Sub Button1_Click(ByVal sender As Object, ByVal e As System.EventArgs) Handles Button1.Click Dim i As Integer TChart1.Aspect.View3D = False Bar1.Marks.Visible = False For i = 0 To 10000 Step 100 Bar1.Add(Rnd() * i) Next With TChart1.Axes.Left .LogarithmicBase = 10 .Logarithmic = True .SetMinMax(0, 10000) .Labels.ValueFormat = "#e+0" ' exponential format End With End Sub
标签将根据对数基数(默认为10)进行设置,因此,在这种情况下,标签将被设置为1、10、100、1000、10000。
Ticks and Minor
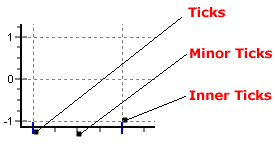
有3种刻度线类型和2种 格类型。你可以改变每个刻度线和 格类型的长度、宽度和颜色。可以通过 “Ticks “选项卡对Ticks、其相关的Grid和Inner Ticks进行更改;对Minor Ticks和其相关的Grid的更改可以通过 “Minor “选项卡进行。TeeChart Pro第5版的新功能是可以改变宽度大于1(默认)的Ticks和Grid的样式。
[C#.Net] Steema.TeeChart.Axis bottomAxis = tChart1.Axes.Bottom; bottomAxis.Ticks.Length = 7; bottomAxis.Ticks.Color = Color.Green; bottomAxis.MinorTickCount = 10; [VB.Net] With TChart1.Axes.Bottom .Ticks.Length = 7 .Ticks.Color = Color.Green .MinorTickCount = 10 End With
轴的位置
轴有一个属性可以修改每个轴的位置。在这个例子中,轴被移动到图表总宽度的50%,所以它被显示在图表中心。
[C#.Net] Steema.TeeChart.Axis bottomAxis = tChart1.Axes.Bottom; bottomAxis.PositionUnits = PositionUnits.Percent; bottomAxis. RelativePosition = 50 [VB.Net] With TChart1.Axes.Bottom .PositionUnits = PositionUnits.Percent .RelativePosition = 50 End With
附加轴
复制坐标轴
TeeChart提供5个与数据系列相关的轴。左侧、顶部、底部、右侧和深度。当你在图表中添加一个新的系列时,你可以定义该系列应该与哪个轴相关(进入系列标签,常规页面)。您可以通过使用Axis Customdraw方法在图表的任何地方重复前4个轴的任何一个(或全部)。请注意,这种方法是对你的轴进行复制,而不是添加一个新的自定义轴。更多信息请参见下一节 “多个自定义轴”。
举例:
[C#.Net] private void Form1_Load(object sender, System.EventArgs e) Random Rnd = new Random(); tChart1.Aspect.View3D = false; tChart1.Panel.Gradient.Visible = true; for(int t = 0; t <= 20; ++t) line1.Add(t, ((Rnd.Next(100)) + 1) - ((Rnd.Next(70)) + 1), Color.Red); private void line1_BeforeDrawValues(object sender, Steema.TeeChart.Drawing.Graphics3D g) int posAxis = 0; if(tChart1.Axes.Left.Maximum > 0) tChart1.Axes.Left.Draw(g.ChartXCenter - 10,g.ChartXCenter - 20,g.ChartXCenter,true); posAxis = tChart1.Axes.Left.CalcYPosValue(10); tChart1.Axes.Bottom.Draw(posAxis + 10, posAxis + 40, posAxis, true); [VB.Net] Private Sub Form1_Load(ByVal sender As System.Object, ByVal e As System.EventArgs) Handles MyBase.Load Dim t As Integer TChart1.Aspect.View3D = False TChart1.Panel.Gradient.Visible = True For t = 0 To 20 Line1.Add(t, ((Rnd() * 100) + 1) - ((Rnd() * 70) + 1), Color.Red) Next End Sub Private Sub Line1_BeforeDrawValues(ByVal sender As Object, ByVal g As Steema.TeeChart.Drawing.Graphics3D) Handles Line1.BeforeDrawValues Dim posAxis As Integer If TChart1.Axes.Left.Maximum > 0 Then TChart1.Axes.Left.Draw(g.ChartXCenter - 10, g.ChartXCenter - 20, g.ChartXCenter, True) posAxis = TChart1.Axes.Left.CalcYPosValue(10) TChart1.Axes.Bottom.Draw(posAxis + 10, posAxis + 40, posAxis, True) End If End Sub
上面的示例代码将产生以下图像。


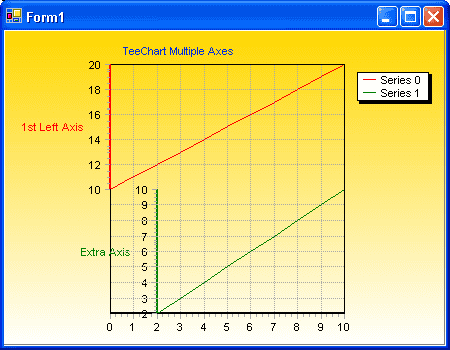
Via Code [C#.Net] private void Form1_Load(object sender, System.EventArgs e) Line line1 = new Line(); Line line2 = new Line(); tChart1.Aspect.View3D = false; tChart1.Panel.Gradient.Visible = true; tChart1.Header.Text = "TeeChart Multiple Axes"; tChart1.Series.Add(line1); tChart1.Series.Add(line2); for(int t = 0; t <= 10; ++t) line1.Add(Convert.ToDouble(t), Convert.ToDouble(10 + t), Color.Red); if(t > 1) line2.Add(Convert.ToDouble(t), Convert.ToDouble(t), Color.Green); Axis leftAxis = tChart1.Axes.Left; leftAxis.StartPosition = 0; leftAxis.EndPosition = 50; leftAxis.AxisPen.Color = Color.Red; leftAxis.Title.Font.Color = Color.Red; leftAxis.Title.Font.Bold = true; leftAxis.Title.Text = "1st Left Axis"; // You are able to then position the new Axis in overall relation to the Chart // by using the StartPosition and EndPosition properties. // // StartPosition=50 // EndPosition=100 // // These figures are expressed as percentages of the Chart Rectangle with 0 (zero) // (in the case of a vertical Axis) being Top. These properties can be applied to // the Standard Axes to create completely partitioned 'SubCharts' within the Chart. Axis axis1 = new Axis(false, false, tChart1.Chart); tChart1.Axes.Custom.Add(axis1); line2.CustomVertAxis = axis1; axis1.StartPosition = 50; axis1.EndPosition = 100; axis1.AxisPen.Color = Color.Green; axis1.Title.Font.Color = Color.Green; axis1.Title.Font.Bold = true; axis1.Title.Text = "Extra Axis"; axis1.PositionUnits= PositionUnits.Percent; axis1.RelativePosition = 20; [VB.Net] Private Sub Form1_Load(ByVal sender As System.Object, ByVal e As System.EventArgs) Handles MyBase.Load Dim Line1 As New Steema.TeeChart.Styles.Line() Dim Line2 As New Steema.TeeChart.Styles.Line() Dim t As Integer TChart1.Aspect.View3D = False TChart1.Panel.Gradient.Visible = True TChart1.Header.Text = "TeeChart Multiple Axes" TChart1.Series.Add(Line1) TChart1.Series.Add(Line2) For t = 0 To 10 Line1.Add(t, 10 + t, Color.Red) If (t > 1) Then Line2.Add(t, t, Color.Green) End If Next With TChart1.Axes.Left .StartPosition = 0 .EndPosition = 50 .AxisPen.Color = Color.Red .Title.Font.Color = Color.Red .Title.Font.Bold = True .Title.Text = "1st Left Axis" End With 'You are able to then position the new Axis in overall relation to the Chart 'by using the StartPosition and EndPosition properties. ' StartPosition = 50 ' EndPosition = 100 'These figures are expressed as percentages of the Chart Rectangle with 0 (zero) '(in the case of a vertical Axis) being Top. These properties can be applied to 'the Standard Axes to create completely partitioned 'SubCharts' within the Chart. Dim Axis1 As New Steema.TeeChart.Axis(False, False, TChart1.Chart) TChart1.Axes.Custom.Add(Axis1) Line2.CustomVertAxis = Axis1 Axis1.StartPosition = 50 Axis1.EndPosition = 100 Axis1.AxisPen.Color = Color.Green Axis1.Title.Font.Color = Color.Green Axis1.Title.Font.Bold = True Axis1.Title.Text = "Extra Axis" Axis1.PositionUnits.= PositionUnits.Percent; Axis1.RelativePosition = 20 End Sub
上面的编码例子
…将显示以下图表。
多轴
选项是无限的! 我们建议在使用自定义轴时要谨慎,因为很容易开始用新的轴来填满屏幕,并失去了你希望管理的轴的踪迹!
轴事件
轴事件提供了运行时的灵活性,以修改轴标签,并在轴点击时呈现用户的互动性。
OnClickAxis
参见OnClickAxis事件。
例如:
[C#.Net] private void tChart1_ClickAxis(object sender, System.Windows.Forms.MouseEventArgs e) if(((Steema.TeeChart.Axis)sender).Equals(tChart1.Axes.Bottom)) MessageBox.Show("Clicked Bottom Axis at: " + line1.XScreenToValue(e.X)); [VB.Net] Private Sub TChart1_ClickAxis(ByVal sender As Object, ByVal e As System.Windows.Forms.MouseEventArgs) Handles TChart1.ClickAxis If CType(sender, Steema.TeeChart.Axis) Is TChart1.Axes.Bottom Then MsgBox("Clicked Bottom Axis at: " & Line1.XScreenToValue(e.X)) End If End Sub
OnGetAxisLabel
可以用来修改轴的标签。参见OnGetAxisLabel事件。
例如
[C#.Net] private void button1_Click(object sender, System.EventArgs e) bar1.FillSampleValues(20); tChart1.Axes.Bottom.Labels.Style = AxisLabelStyle.Mark; private void tChart1_GetAxisLabel(object sender, Steema.TeeChart.TChart.GetAxisLabelEventArgs e) if(((Steema.TeeChart.Axis)sender).Equals(tChart1.Axes.Bottom)) e.LabelText = "Period " + Convert.ToString(e.ValueIndex); [VB.Net] Private Sub Button1_Click(ByVal sender As Object, ByVal e As System.EventArgs) Handles Button1.Click Bar1.FillSampleValues(20) TChart1.Axes.Bottom.Labels.Style = Steema.TeeChart.AxisLabelStyle.Mark End Sub Private Sub TChart1_GetAxisLabel(ByVal sender As Object, ByVal e As Steema.TeeChart.TChart.GetAxisLabelEventArgs) Handles TChart1.GetAxisLabel If CType(sender, Steema.TeeChart.Axis) Is TChart1.Axes.Bottom Then e.LabelText = "Period " & e.ValueIndex End If End Sub
OnGetNextAxisLabel
可以用来决定哪些轴的标签应该被显示。参见OnGetNextAxisLabel事件。你应该使用e.Stop布尔属性来包括/排除轴标签。
例如:
[C#.Net] private void Form1_Load(object sender, System.EventArgs e) line1.FillSampleValues(20); private void tChart1_GetNextAxisLabel(object sender, Steema.TeeChart.TChart.GetNextAxisLabelEventArgs e) if(((Steema.TeeChart.Axis)sender).Equals(tChart1.Axes.Bottom)) e.Stop = false; switch(e.LabelIndex) case 0: e.LabelValue = 5; break; case 1: e.LabelValue = 13; break; case 2: e.LabelValue = 19; break; default: e.Stop = true; break; [VB.Net] Private Sub Form1_Load(ByVal sender As System.Object, ByVal e As System.EventArgs) Handles MyBase.Load Line1.FillSampleValues(20) End Sub Private Sub TChart1_GetNextAxisLabel(ByVal sender As Object, ByVal e As Steema.TeeChart.TChart.GetNextAxisLabelEventArgs) Handles TChart1.GetNextAxisLabel If CType(sender, Steema.TeeChart.Axis) Is TChart1.Axes.Bottom Then e.Stop = False Select Case e.LabelIndex Case 0 : e.LabelValue = 5 Case 1 : e.LabelValue = 13 Case 2 : e.LabelValue = 19 Case Else : e.Stop = True End Select End If End Sub

以上就是TeeChart系列教程中的关于“轴控制”介绍的全部内容了,点击查看完整详情。
如果您想了解TeeChart for .NET价格,欢迎咨询在线客服
TeeChart for .NET 是优秀的工业4.0 WinForm图表控件,官方独家授权汉化,集功能全面、性能稳定、价格实惠等优势于一体。
标签:
声明:本站部分文章及图片源自用户投稿,如本站任何资料有侵权请您尽早请联系jinwei@zod.com.cn进行处理,非常感谢!