Web图表控件ChartDirector连载教程分享之离散数据表面图,内附下载和链接。
ChartDirector是一个非常理想的图表工具,它拥有广泛的图表类型、分层架构、实时互动的大数据表、普遍适应于各种应用程序以及支持PDF和SVG图标等的优点。此系列连载旨在介绍ChartDirector的实用教程,供大家学习讨论。
分散的数据表面图
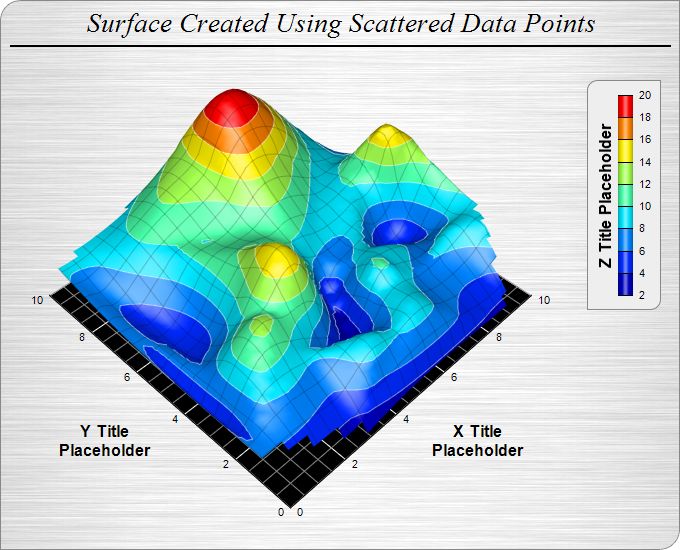

此示例演示了使用曲面图的离散数据以及如何隐藏绘图区域墙壁并改变其厚度和颜色。
在先前的曲面图示例中,数据是 格化的,这意味着数据点的(x,y)坐标位于矩形 格上。ChartDirector还支持分散的数据点,这意味着数据点可以位于任意位置。ChartDirector会自动检测使用SurfaceChart.setData传递到曲面图的数据是 格还是分散。
在此示例中,使用ThreeDChart.setWallVisibility隐藏3个绘图区域墙中的2个。对于可见墙,使用ThreeDChart.setWallColor将其颜色设置为黑色时,其厚度设置为0。其主要和次要的格子线是使用ThreeDChart.setWallGrid设置为白色和灰色。
源代码清单
以下代码可在“cppdemo / scattersurface ”中找到。MFC版本的代码可在“mfcdemo”中找到(仅限Windows版本)。QT版本的代码可在“qtdemo”中找到。
#include "chartdir.h"int main(int argc, char *argv[]){ // The (x, y, z) coordinates of the scattered data double dataX[] = {0.5, 1.9, 4.9, 1.0, 8.9, 9.8, 5.9, 2.9, 6.8, 9.0, 0.0, 8.9, 1.9, 4.8, 2.4, 3.4, 7.9, 7.5, 4.8, 7.5, 9.5, 0.4, 8.9, 0.9, 5.4, 9.4, 2.9, 8.9, 0.9, 8.9, 10.0, 1.0, 6.8, 3.8, 9.0, 5.3, 6.4, 4.9, 4.5, 2.0, 5.4, 0.0, 10.0, 3.9, 5.4, 5.9, 5.8, 0.3, 4.4, 8.3}; double dataY[] = {3.3, 3.0, 0.7, 1.0, 9.3, 4.5, 8.4, 0.1, 0.8, 0.1, 9.3, 1.8, 4.3, 1.3, 2.3, 5.4, 6.9, 9.0, 9.8, 7.5, 1.8, 1.4, 4.5, 7.8, 3.8, 4.0, 2.9, 2.4, 3.9, 2.9, 2.3, 9.3, 2.0, 3.4, 4.8, 2.3, 3.4, 2.3, 1.5, 7.8, 4.5, 0.9, 6.3, 2.4, 6.9, 2.8, 1.3, 2.9, 6.4, 6.3}; double dataZ[] = {6.6, 12.5, 7.4, 6.2, 9.6, 13.6, 19.9, 2.2, 6.9, 3.4, 8.7, 8.4, 7.8, 8.0, 9.4, 11.9, 9.6, 15.7, 12.0, 13.3, 9.6, 6.4, 9.0, 6.9, 4.6, 9.7, 10.6, 9.2, 7.0, 6.9, 9.7, 8.6, 8.0, 13.6, 13.2, 5.9, 9.0, 3.2, 8.3, 9.7, 8.2, 6.1, 8.7, 5.6, 14.9, 9.8, 9.3, 5.1, 10.8, 9.8 }; // Create a SurfaceChart object of size 680 x 550 pixels. Set background to brushed silver and // border to grey (888888). Set the top-left and bottom-right corners to rounded corners with 20 // pixels radius. SurfaceChart *c = new SurfaceChart(680, 550, Chart::brushedSilverColor(), 0x888888); c->setRoundedFrame(0xffffff, 20, 0, 20, 0); // Add a title to the chart using 20 points Times New Roman Italic font. Set top/bottom margin // to 8 pixels. TextBox *title = c->addTitle("Surface Created Using Scattered Data Points", "timesi.ttf", 20); title->setMargin(0, 0, 8, 8); // Add a 2 pixel wide black (000000) separator line under the title c->addLine(10, title->getHeight(), c->getWidth() - 10, title->getHeight(), 0x000000, 2); // Set the center of the plot region at (290, 235), and set width x depth x height to 360 x 360 // x 180 pixels c->setPlotRegion(290, 235, 360, 360, 180); // Set the elevation and rotation angles to 45 and -45 degrees c->setViewAngle(45, -45); // Set the perspective level to 30 c->setPerspective(30); // Set the data to use to plot the chart c->setData(DoubleArray(dataX, (int)(sizeof(dataX) / sizeof(dataX[0]))), DoubleArray(dataY, (int)(sizeof(dataY) / sizeof(dataY[0]))), DoubleArray(dataZ, (int)(sizeof(dataZ) / sizeof( dataZ[0])))); // Add a color axis (the legend) in which the top right corner is anchored at (660, 80). Set the // length to 200 pixels and the labels on the right side. ColorAxis *cAxis = c->setColorAxis(660, 80, Chart::TopRight, 200, Chart::Right); // Set the color axis title with 12 points Arial Bold font cAxis->setTitle("Z Title Placeholder", "arialbd.ttf", 12); // Add a bounding box with light grey (eeeeee) background and grey (888888) border. Set the // top-left and bottom-right corners to rounded corners of 10 pixels radius. cAxis->setBoundingBox(0xeeeeee, 0x888888); cAxis->setRoundedCorners(10, 0, 10, 0); // Set surface grid lines to semi-transparent black (cc000000) c->setSurfaceAxisGrid(0xcc000000); // Set contour lines to semi-transparent white (80ffffff) c->setContourColor(0x80ffffff); // Set the walls to black in color c->setWallColor(0x000000); // Set the xyz major wall grid lines to white (ffffff), and minor wall grid lines to grey // (888888) c->setWallGrid(0xffffff, 0xffffff, 0xffffff, 0x888888, 0x888888, 0x888888); // Set the wall thickness to 0 c->setWallThickness(0, 0, 0); // Show only the xy wall, and hide the yz and zx walls. c->setWallVisibility(true, false, false); // Set the x, y and z axis titles using 12 points Arial Bold font c->xAxis()->setTitle("X TitlenPlaceholder", "arialbd.ttf", 12); c->yAxis()->setTitle("Y TitlenPlaceholder", "arialbd.ttf", 12); // Output the chart c->makeChart("scattersurface.jpg"); //free up resources delete c; return 0;}
想要购买ChartDirector正版授权,或者获取更多该产品相关信息的朋友可以点击” 咨询在线客服 “~
海量产品正在参加年终大促,价格优惠!详情请点击” 年终巅峰钜惠 “~
标签:Web图表交互图表
声明:本站部分文章及图片源自用户投稿,如本站任何资料有侵权请您尽早请联系jinwei@zod.com.cn进行处理,非常感谢!