你可能已经开发了一个桌面应用程序,并要求将 告图表发布到 页上。这篇文章回顾了TeeChart的选项,为浏览器页面创建Javascript。
使用TeeChart的导出到HTML5和/或Javascript选项,在HTML5 Canvas上创建本地静态或实时浏览器图表。
导出静态HTML5
这个选项创建了一个Javascript的低级渲染指令序列,以相同的方式再现了基于桌面的图表。要运行一个输出,首先要在你的项目中添加一个用途。
uses VCLTee.TeeHTML5Canvas;
接下来运行以下代码导出:
procedure TForm1.Button2Click(Sender: TObject);var exporter: THTML5ExportFormat;begin //HTML5 Canvas fixed graphic exporter:=THTML5ExportFormat.Create; TeeSaveToHTML5File(Chart1,AppDir + 'myoutput1_HTML5_Canvas_Chart.htm', DesWidth, DesHeight); exporter.Width:=DesWidth; exporter.Height:=DesHeight; exporter.Panel:=Chart1; Memo1.Lines:=exporter.HTML5;end;
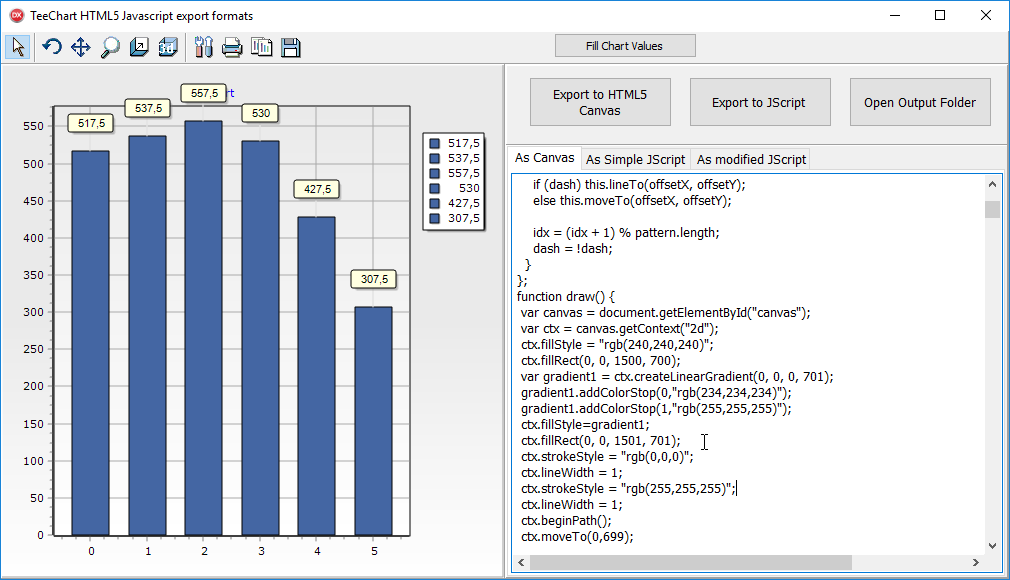

出口输出脚本在右边。
该输出创建了HTML页面脚本和Javascript代码线,逐行渲染指令,在HTML5画布上绘制每个图表元素。
例子:
function draw() { var canvas = document.getElementById("canvas"); var ctx = canvas.getContext("2d"); ctx.fillStyle = "rgb(240,240,240)"; ctx.fillRect(0, 0, 1500, 700); var gradient1 = ctx.createLinearGradient(0, 0, 0, 701); gradient1.addColorStop(0,"rgb(234,234,234)"); gradient1.addColorStop(1,"rgb(255,255,255)"); ctx.fillStyle=gradient1; ctx.fillRect(0, 0, 1501, 701); ctx.strokeStyle = "rgb(0,0,0)"; ctx.lineWidth = 1; ctx.strokeStyle = "rgb(255,255,255)"; ctx.lineWidth = 1; ctx.beginPath();}
以Javascript导出为实时图表
支持的系列类型:线形、区域、条形、饼形、点形、甜甜圈、泡沫、蜡烛、甘特图、彩 、表面3D、地图。
与TeeChart HTML5导出不同,Javascript导出使用TeeChart自己的Javascript库(见https://steema.com/product/html5)。导出会创建必要的代码行,以使用该库并创建基于Delphi的图表的复制品。要运行一个导出,首先要在你的项目中添加一个使用。
uses VCLTee.TeeJavascript
接下来给页面按钮添加一个事件:
var exporter: TJavascriptExportFormat; CustCodeStr : TStringlist; srcLinks : TStrings;begin //Javascript - "live" chart export. exporter:=TJavascriptExportFormat.Create; exporter.Width := DesiredWidth; exporter.Height := DesiredHeight; exporter.SaveToFile(Chart1,AppDir + 'myoutput2_Chartfromcode.htm');
这将创建以下类型的输出,你可以选择将输出设置为一个完整的html页面或作为一个有多个元素的页面的一部分,teechart.js是图标库,因此你要检查是否引入。
<title>Chart1</title><script src="http://www.steema.com/files/public/teechart/html5/latest/src/teechart.js" type="text/javascript"></script><script type="text/javascript">var Chart1;function draw() { Chart1=new Tee.Chart("Canvas1"); Chart1.panel.format.fill="#F0F0F0"; Chart1.panel.format.round.x=0; Chart1.panel.format.round.y=0; Chart1.panel.format.stroke.fill=""; Chart1.panel.format.stroke.cap="round"; Chart1.panel.format.gradient.colors=["#EAEAEA","#EAEAEA","#FFFFFF"]; Chart1.panel.format.gradient.stops=[0,0.5,1]; Chart1.panel.format.gradient.direction="topbottom"; Chart1.panel.format.gradient.visible=true; Chart1.panel.margins.left=3; Chart1.panel.margins.right=3;
自定义图表
这里是一个如何为图表添加修改的例子,可以改变图表主题、标题、字体,或者在图表本身添加内容。在这里,我们在导出前向解析的Javascript代码添加一些自定义行,这里使用Memo组件将一些额外的参考行与对Javascript函数的调用结合起来。
CustCodeStr := TStringlist.Create;CustCodeStr.Add(' addFeatures('+exporter.ChartName+');');exporter.CustomCode := CustCodeStr;
这里我们要添加一个对javascript代码单元的引用,jutils.js,然后保存到文件中。
With Memo3 doBegin Lines := exporter.JScript; Lines.Insert(6,'<script src="jutils.js" type="text/javascript"></script>'); Lines.Insert(6,'<script src="'+exporter.SourceScriptPath+'/teechart-animations.js" type="text/javascript"></script>'); Lines.Insert(6,'<script src="'+exporter.SourceScriptPath+'/teechart-extras.js" type="text/javascript"></script>'); Lines.SaveToFile(AppDir + 'myoutput3_Chart_JScript_mods.htm');End;
jutils的addFeatures方法包括了我们想做的修改,比如说:
function addFeatures(aChart) { aChart.applyTheme("minimal"); //turn off marks aChart.series.items[0].marks.visible = false; //animation animation=new Tee.SeriesAnimation(); animation.duration=2000; animation.kind="each"; fadeAnimation=new Tee.FadeAnimation(); fadeAnimation.duration=500; fadeAnimation.fade.series=true; fadeAnimation.fade.marks=true; animation.mode = "linear"; fadeAnimation.mode = "linear"; animation.items.push(fadeAnimation); animation.animate(aChart); //tooltip tip=new Tee.ToolTip(aChart); tip.render="dom"; tip.autoHide=true; tip.domStyle = "padding-left:8px; padding-right:8px; padding-top:0px; padding-bottom:4px; margin-left:5px; margin-top:0px; "; tip.domStyle = tip.domStyle + "background-color:#FCFCFC; border-radius:4px 4px; color:#FFF; "; tip.domStyle = tip.domStyle + "border-style:solid;border-color:#A3A3AF;border-width:1px; z-index:1000;"; aChart.tools.add(tip); tip.onhide=function() { scaling=0; poindex=-1; } tip.ongettext=function( tool, text, series, index) { var s = '<font face="verdana" color="black" size="1"><strong>'+ series.title+'</strong></font>'; s = s + '<br/><font face="verdana" color="darkblue" size="1">Series point: <strong>'+ index.toFixed(0)+'</strong></font>'; s = s +'<br/><font face="verdana" color="red" size="1">Value: '+series.data.values[index].toFixed(2)+'</font>'; return s; }}
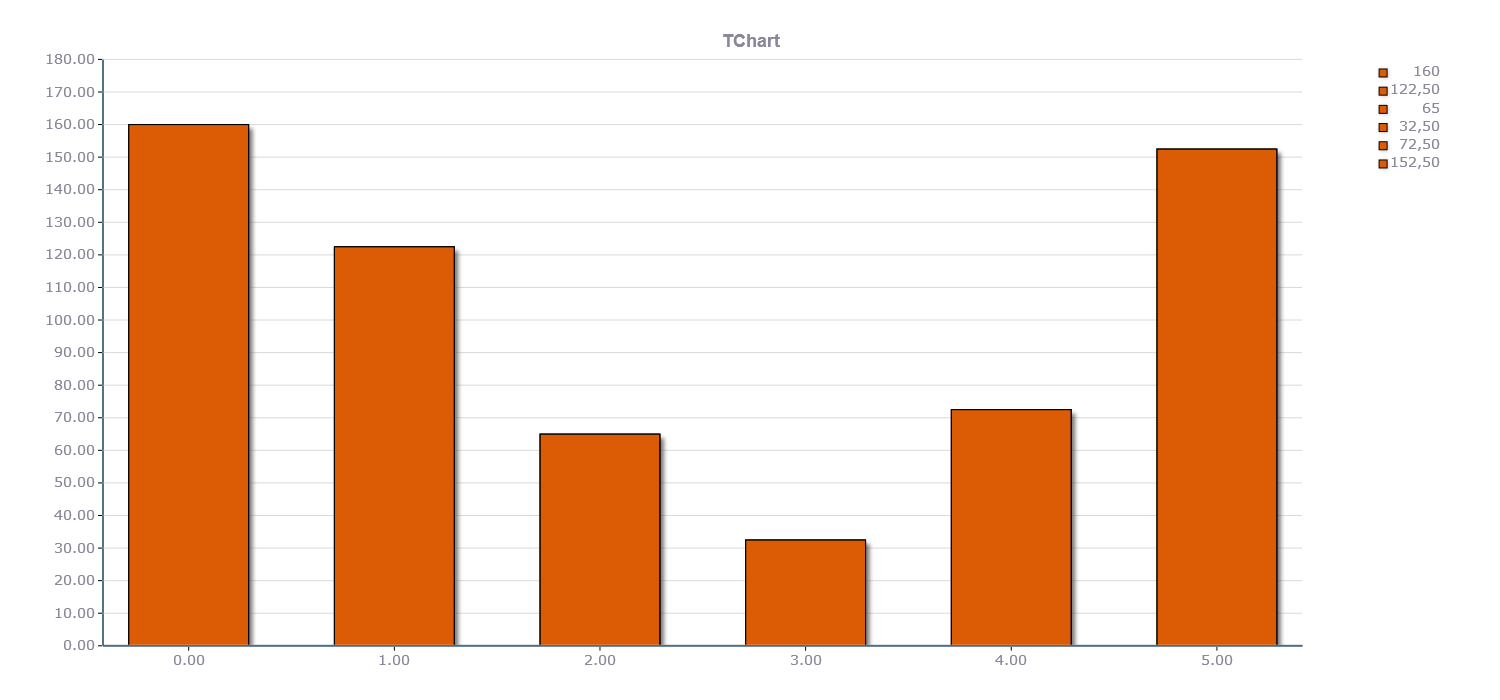
图表的输出增加了一次加载时间、动画和标记提示。结果如下:https://www.steema.com/files/public/teechart/vclfmx/jscriptdemo/3_Chart_JScript_mods.htm
标签:
声明:本站部分文章及图片源自用户投稿,如本站任何资料有侵权请您尽早请联系jinwei@zod.com.cn进行处理,非常感谢!