【下载TeeChart for Java最新版本】
(一)功能类型
1.1 功能特点
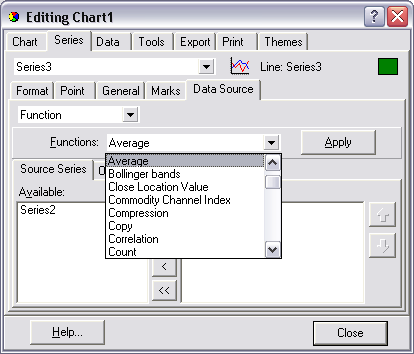
TeeChart Pro功能是一个系列,几乎可以是任何系列类型,应用代数函数,数据源是另一个图表系列。所有函数都派生自TeeFunction Component并继承TeeFunction的Period 方法。TeeChart Pro包含以下预定义功能列表,有关所有功能类型的完整列表,请参阅TeeChart Editor Gallery和Helpfile:
| 功能类型 | 投入数量 | 描述 |
| Add | 无限 | 绘制输入总和 |
| Average | 无限 | 平均函数将计算每组Period点的平均值 |
| Copy | 1 | 输入系列的直接副本 |
| Divide | 无限 | 分割函数绘制输入按包含的降序划分 |
| High | 无限 | 高功能绘制高输入点 |
| Low | 无限 | 低功能绘制低输入点 |
| Multiply | 无限 | 乘法函数绘制输入值的乘积 |
| Subtract | 无限 | 绘图的输入值按包含的降序减去 |
| Mode | 1 | mode函数返回重复多次的源序列值 |
| Median | 1 | 计算源系列值的中值 |
| Count | 1 | 在Y位置绘制水平线,该水平线由基础系列中的点数定义。 |
| Pro版本的子集(仅函数) | ||
| Bollinger | 1 | 布林线函数使用简单或指数移动平均线来构建布林线交易区间 |
| Curve Fitting | 1 | 使用TypeFitting公式通过数据输入绘制拟合多项式 |
| Exponential Average | 1 | 基于权重的指数平均值 |
| Exponential Moving Average | 1 | 基于权重的指数移动平均线 |
| Exponential Trend | 1 | 通过输入系列中的点绘制最佳指数趋势线 |
| MACD | 1 | 移动平均收敛分歧 |
| Momentum | 1 | 每个Y值是当前点的Y值减去最后一个Period点的Y值 |
| Momentum Division | 1 | 每个Y值是当前点的Y值除以最后一个Period点的YValue,以百分比表示 |
| Moving Average | 1 | 移动平均线功能将计算每组周期点的简单或加权平均值 |
| Root Mean Square | 无限 | 均方根函数绘制输入的RMS值 |
| Relative Strength Index | 1 | RSI函数根据财务数据计算百分比值。根据TRSISyle类型,将使用不同的公式来计算RSI值 |
| Standard Deviation | 1 | 映射每组Period点的标准偏差(或完全标准差) |
| Stochastic | 1 | |
| Trend | 1 | 通过输入系列点绘制最佳趋势线 |
多种函数类型仅支持一个输入系列。但是,可以链接链接函数,例如,将图表中多个系列的平均值创建为平均函数系列,然后使用平均函数作为趋势函数的输入来标识平均值的趋势。
1.2 添加功能

假设我们从一个完全空的Chart开始,这里是代码中用于构建简单的Series-Function相关Chart的步骤。
private void Load() {//Add a data SeriesLine line1 = new Line(tChart1.getChart());//Populate it with data (here random)line1.fillSampleValues(10); //Add a series to be used for an Average FunctionLine line2 = new Line(tChart1.getChart()); //Define the Function Type for the new Seriescom.steema.teechart.functions.Average average1 = new com.steema.teechart.functions.Average();line2.setFunction(average1); //Define the Datasource for the new Function Seriesline2.setDataSource(line1); //*Note - When populating your input Series manually you will need to//use the Checkdatasource method//- See the section entitled 'Defining a Datasource'//Change the Period of the Function so that it groups averages//every 2 Pointsline2.getFunction().setPeriod(2);line2.checkDataSource();}
添加另一个函数来介绍有关前一个函数的信息
public void button1_actionPerformed(ActionEvent e) {//Let's change to 2D for visibilitytChart1.getAspect().setView3D(false);//Add another Series to be used for a 2nd FunctionLine line3 = new Line(tChart1.getChart());//Define the Function Type for the new Seriescom.steema.teechart.functions.High high1 = new com.steema.teechart.functions.High();line3.setFunction(high1);//Define the Datasource for the new Function Series//Use the existing Function (Series2) as inputline3.setDataSource(tChart1.getSeries(1));//Leave the Period at default 0 (No Period set) to draw//A line at Highest of all points of the Average Function
1.3 定义数据源
private void Load() { tChart1.getAspect().setView3D(false); bar1.fillSampleValues(10); bar2.fillSampleValues(10); }public void button1_actionPerformed(ActionEvent e) { com.steema.teechart.styles.Line line1 = new com.steema.teechart.styles.Line(tChart1.getChart()); com.steema.teechart.functions.Average average3 = new com.steema.teechart.functions.Average(); Object[] tmpDataSource ={bar1,bar1}; line1.setFunction(tmpDataSource); line1.setDataSource(bar1); line1.getMarks().setVisible(true);}
为2系列添加点数:
public void button1_actionPerformed(ActionEvent e) { java.util.Random rnd = new java.util.Random(); for(int i = 0; i < 10; ++i) bar1.add(rnd.nextInt(500)); bar2.add(rnd.nextInt(500)); }}
该功能不会显示。您需要使用checkDataSource方法读入Function的值。
tChart1.getSeries(2).checkDataSource();
可以在运行时更改函数定义,只需通过重新定义Series.DataSource方法将新函数分配给Series:
public void button3_actionPerformed(ActionEvent e) {com.steema.teechart.functions.Cumulative cumulative1 = new com.steema.teechart.functions.Cumulative();tChart1.getSeries(2).setFunction(cumulative1);
购买Steema正版授权,请点击“咨询在线客服”哟!

标签:JavaScript 图表teechart
声明:本站部分文章及图片源自用户投稿,如本站任何资料有侵权请您尽早请联系jinwei@zod.com.cn进行处理,非常感谢!