Arction Ltd从事高性能的大数据可视化研发近15年,其下产品LightningChart处于行业绝对领先水平,本使用教程将会带您学会如何使用
LightningChart提供了两种不同的方式将数据表示为 3D 表面 – SurfaceGridSeries3D和SurfaceMeshSeries3D。
在 SurfaceGridSeries3D 中,节点在 X 和 Z 维度上等距分布,而在SurfaceMeshSeries3D中,节点可以在 3D 空间中自由定位。
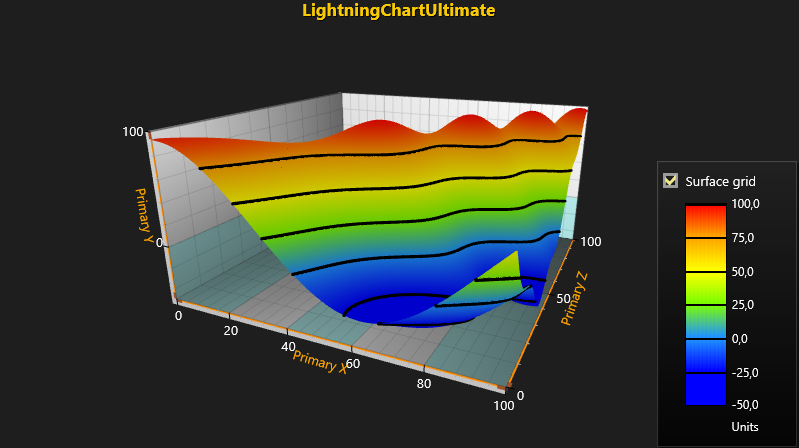
本教程展示了如何使用LightningChart SurfaceGridSeries3D创建带有线框和轮廓线的简单 3D SurfaceGrid 。SurfaceGrid 允许将数据可视化为 3D 表面,并可用于表示、测量和检查数据及其方差。
本教程中使用调色板着色来根据数据的值以不同的颜色表示数据。建议先简要了解一下我们的热图教程,其中解释了调色板着色,然后再继续本教程。

在本教程中,我们预定义了一些变量,以便于使用和清晰。在 Form 或 MainWindow 类中定义以下变量,如下所示。
////// LightningChart component./// private LightningChartUltimate _chart = null;////// Reference to SurfaceGrid series in chart./// private SurfaceGridSeries3D _surfaceGrid = null;////// SurfaceGrid rows./// int _rows = 500;////// SurfaceGrid columns./// int _columns = 500;////// Minimum X-axis value./// private const int MinX = 0;////// Maximum X-axis value./// private const int MaxX = 100;////// Minimum Z-axis value./// private const int MinZ = 0;////// Maximum Z-axis value./// private const int MaxZ = 100;
1. 将 View3D 定义为活动视图并定义 Y 轴范围。
// Set View3D as active view and set Y-axis range._chart.ActiveView = ActiveView.View3D;_chart.View3D.YAxisPrimary3D.SetRange(-50, 100);
2. 创建一个新的 SurfaceGrid 实例作为 SurfaceGridSeries3D。
// Create a new SurfaceGrid instance as SurfaceGridSeries3D._surfaceGrid = new SurfaceGridSeries3D(_chart.View3D, Axis3DBinding.Primary, Axis3DBinding.Primary, Axis3DBinding.Primary);
3. 定义 SurfaceGrid 的设置。
// Set range, size and color saturation options for SurfaceGrid._surfaceGrid.RangeMinX = MinX;_surfaceGrid.RangeMaxX = MaxX;_surfaceGrid.RangeMinZ = MinZ;_surfaceGrid.RangeMaxZ = MaxZ;_surfaceGrid.SizeX = _columns;_surfaceGrid.SizeZ = _rows;// Stronger colors._surfaceGrid.ColorSaturation = 80;
4. 创建 ValueRangePalette 并将其设置为 SurfaceGrid 的 ContourPalette。
// Create ValueRangePalette for coloring SurfaceGrid's data.ValueRangePalette palette = CreatePalette(_surfaceGrid);_surfaceGrid.ContourPalette = palette;
5. 为 SurfaceGrid 定义线框和轮廓线。
// Define WireFrameType and ContourLineType for SurfaceGrid._surfaceGrid.WireframeType = SurfaceWireframeType3D.WireframePalettedByY;_surfaceGrid.ContourLineType = ContourLineType3D.ColorLineByY;_surfaceGrid.ContourLineWidth = 2;
6. 生成数据。
// Generate data.public void GenerateData(int columns, int rows){ // Create variable for storing data. double data = 0; // Disable rendering before updating chart properties to improve performance // and to prevent unnecessary chart redrawing while changing multiple properties. _chart.BeginUpdate(); // Set data values and add them to SurfaceGrid. for (int i = 0; i < _columns; i++) { for (int j = 0; j < _rows; j++) { // Add values to the SurfaceGrid as SurfacePoints, points are distributed by using following function. data = 30.0 + 8 * Math.Cos(20 + 0.0001 * (double)(i * j)) + 60.0 * Math.Cos((double)(j - i) * 0.01); _surfaceGrid.Data[i, j].Y = data; } } // Notify chart about updated data. _surfaceGrid.InvalidateData(); // Call EndUpdate to enable rendering again. _chart.EndUpdate(); }
如果您对该图表控件感兴趣,欢迎加入图表控件QQ交流群:
如果你想了解LightningChart.NET正版价格,欢迎查看产品介绍或咨询在线客服
标签:
声明:本站部分文章及图片源自用户投稿,如本站任何资料有侵权请您尽早请联系jinwei@zod.com.cn进行处理,非常感谢!