Web图表控件ChartDirector连载教程分享之盒须图,内附下载和链接。
ChartDirector是一个非常理想的图表工具,它拥有广泛的图表类型、分层架构、实时互动的大数据表、普遍适应于各种应用程序以及支持PDF和SVG图标等的优点。此系列连载旨在介绍ChartDirector的实用教程,供大家学习讨论。
一、盒须图(一)
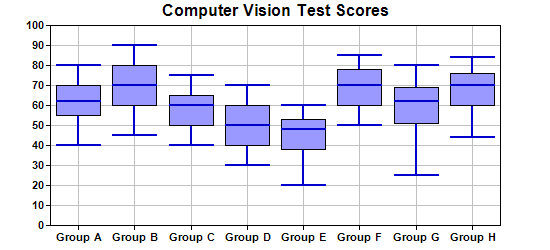

此示例演示了如何创建盒须图。标准盒须图使用盒须符 可以绘制最多5个数据集。这5个数据集尽管可以表示任何类型的量,但他们一般被称为最大值、四分之三值、中间值、四分之一值和最小值。
在盒须符 中,四分之三和四分之一值表示方框。最大值、最小值和中间值表示水平标记。其中有一条垂直线连接最大值和最小值。 在ChartDirector中,XYChart.addBoxWhiskerLayer和XYChart.addBoxWhiskerLayer2可用于创建单色和多色盒须层。
创建盒须层时,不需要存在所有5个数据集。一种常见用法是仅提供四分之三和四分之一值的数据(将其他参数保留为空数组),以此仅绘制图表的“Box”部分,形成浮动框图。另一种常见用法是仅提供最大值和最小值以仅绘制图表的“Whisker”部分,它们可用作“error symbols”。您甚至可以仅提供中间值数据来绘制浮动标记线。
源代码清单
以下代码可在“cppdemo/simplebar”中找到。MFC版本的代码可在“mfcdemo / mfcdemo”中找到(仅限Windows版本)。QT版本的代码可在“qtdemo/qtdemo”中找到。
#include "chartdir.h"int main(int argc, char *argv[]){ // Sample data for the Box-Whisker chart. Represents the minimum, 1st quartile, medium, 3rd // quartile and maximum values of some quantities double Q0Data[] = {40, 45, 40, 30, 20, 50, 25, 44}; double Q1Data[] = {55, 60, 50, 40, 38, 60, 51, 60}; double Q2Data[] = {62, 70, 60, 50, 48, 70, 62, 70}; double Q3Data[] = {70, 80, 65, 60, 53, 78, 69, 76}; double Q4Data[] = {80, 90, 75, 70, 60, 85, 80, 84}; // The labels for the chart const char *labels[] = {"Group A", "Group B", "Group C", "Group D", "Group E", "Group F", "Group G", "Group H"}; // Create a XYChart object of size 550 x 250 pixels XYChart *c = new XYChart(550, 250); // Set the plotarea at (50, 25) and of size 450 x 200 pixels. Enable both horizontal and // vertical grids by setting their colors to grey (0xc0c0c0) c->setPlotArea(50, 25, 450, 200)->setGridColor(0xc0c0c0, 0xc0c0c0); // Add a title to the chart c->addTitle("Computer Vision Test Scores"); // Set the labels on the x axis and the font to Arial Bold c->xAxis()->setLabels(StringArray(labels, (int)(sizeof(labels) / sizeof(labels[0]))) )->setFontStyle("arialbd.ttf"); // Set the font for the y axis labels to Arial Bold c->yAxis()->setLabelStyle("arialbd.ttf"); // Add a Box Whisker layer using light blue 0x9999ff as the fill color and blue (0xcc) as the // line color. Set the line width to 2 pixels c->addBoxWhiskerLayer(DoubleArray(Q3Data, (int)(sizeof(Q3Data) / sizeof(Q3Data[0]))), DoubleArray(Q1Data, (int)(sizeof(Q1Data) / sizeof(Q1Data[0]))), DoubleArray(Q4Data, (int)( sizeof(Q4Data) / sizeof(Q4Data[0]))), DoubleArray(Q0Data, (int)(sizeof(Q0Data) / sizeof( Q0Data[0]))), DoubleArray(Q2Data, (int)(sizeof(Q2Data) / sizeof(Q2Data[0]))), 0x9999ff, 0x0000cc)->setLineWidth(2); // Output the chart c->makeChart("boxwhisker.png"); //free up resources delete c; return 0;}
二、盒须图(二)
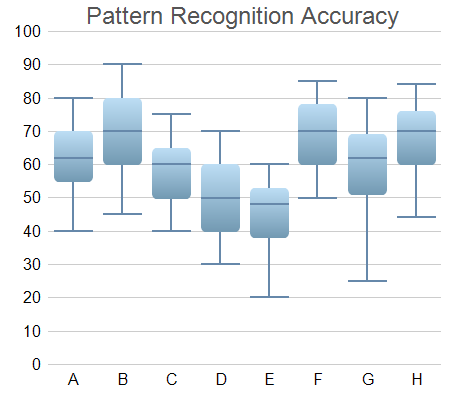
此示例扩展了盒须图(一)的示例,演示了控制图表外观的各种方法,包括使用不同的颜色和不同的字体大小,以及使用渐变着色和圆角的方法。
源代码清单
以下代码可在“cppdemo/simplebar”中找到。MFC版本的代码可在“mfcdemo / mfcdemo”中找到(仅限Windows版本)。QT版本的代码可在“qtdemo/qtdemo”中找到。
#include "chartdir.h"int main(int argc, char *argv[]){ // Sample data for the Box-Whisker chart. Represents the minimum, 1st quartile, medium, 3rd // quartile and maximum values of some quantities double Q0Data[] = {40, 45, 40, 30, 20, 50, 25, 44}; double Q1Data[] = {55, 60, 50, 40, 38, 60, 51, 60}; double Q2Data[] = {62, 70, 60, 50, 48, 70, 62, 70}; double Q3Data[] = {70, 80, 65, 60, 53, 78, 69, 76}; double Q4Data[] = {80, 90, 75, 70, 60, 85, 80, 84}; // The labels for the chart const char *labels[] = {"A", "B", "C", "D", "E", "F", "G", "H"}; // Create a XYChart object of size 450 x 400 pixels XYChart *c = new XYChart(450, 400); // Set the plotarea at (50, 30) and of size 380 x 340 pixels, with transparent background and // border and light grey (0xcccccc) horizontal grid lines c->setPlotArea(50, 30, 380, 340, Chart::Transparent, -1, Chart::Transparent, 0xcccccc); // Add a title box using grey (0x555555) 18pt Arial font TextBox *title = c->addTitle(" Pattern Recognition Accuracy", "arial.ttf", 18, 0x555555); // Set the x and y axis stems to transparent and the label font to 12pt Arial c->xAxis()->setColors(Chart::Transparent); c->yAxis()->setColors(Chart::Transparent); c->xAxis()->setLabelStyle("arial.ttf", 12); c->yAxis()->setLabelStyle("arial.ttf", 12); // Set the labels on the x axis c->xAxis()->setLabels(StringArray(labels, (int)(sizeof(labels) / sizeof(labels[0])))); // For the automatic y-axis labels, set the minimum spacing to 30 pixels. c->yAxis()->setTickDensity(30); // Add a box whisker layer using light blue (0x99ccee) for the fill color and blue (0x6688aa) // for the whisker color. Set line width to 2 pixels. Use rounded corners and bar lighting // effect. BoxWhiskerLayer *b = c->addBoxWhiskerLayer(DoubleArray(Q3Data, (int)(sizeof(Q3Data) / sizeof( Q3Data[0]))), DoubleArray(Q1Data, (int)(sizeof(Q1Data) / sizeof(Q1Data[0]))), DoubleArray( Q4Data, (int)(sizeof(Q4Data) / sizeof(Q4Data[0]))), DoubleArray(Q0Data, (int)(sizeof(Q0Data) / sizeof(Q0Data[0]))), DoubleArray(Q2Data, (int)(sizeof(Q2Data) / sizeof(Q2Data[0]))), 0x99ccee, 0x6688aa); b->setLineWidth(2); b->setRoundedCorners(); b->setBorderColor(Chart::Transparent, Chart::barLighting()); // Adjust the plot area to fit under the title with 10-pixel margin on the other three sides. c->packPlotArea(10, title->getHeight(), c->getWidth() - 10, c->getHeight() - 10); // Output the chart c->makeChart("boxwhisker2.png"); //free up resources delete c; return 0;}
想要购买ChartDirector正版授权,或者获取更多该产品相关信息的朋友可以点击” 咨询在线客服 “~
海量产品正在参加年终大促,价格优惠!详情请点击” 年终巅峰钜惠 “~
标签:Web图表交互图表
声明:本站部分文章及图片源自用户投稿,如本站任何资料有侵权请您尽早请联系jinwei@zod.com.cn进行处理,非常感谢!