此示例显示了使用OHLC系列的OHLC图表的基本实现。


OHLC图表
此示例显示了使用OHLC系列的OHLC图表的基本实现。
// OHLCSeries exists inside XY-charts.const chart = lightningChart().ChartXY()const ohlcSeries = chart.addOHLCSeries( // Specify type of figure used { positiveFigure: OHLCFigures.Bar })
OHLC系列接受接口“ XOHLC”形式的数据:
const xohlc = [ // X-position 0, // Opening Y-value 100, // Highest Y-value 200, // Lowest Y-value 50, // Closing Y-value 75]// Add new segment to series.ohlcSeries.add(xohlc)
add() 可以用单个XOHLC对象或它们的数组调用。
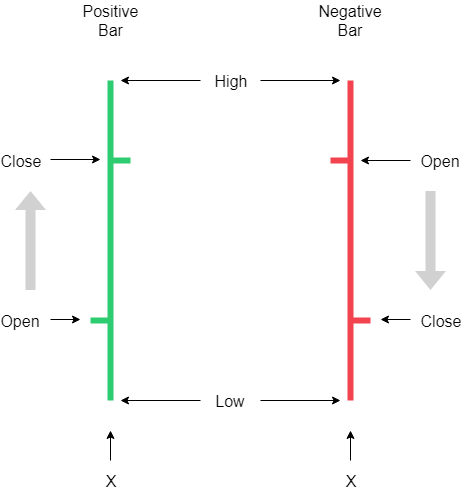
条形图的解剖
条形图由三个线段组成,可以使用单个LineStyle对象设置样式。
图形样式
OHLC系列提供了分别指定正和负烛台样式的功能。
// Width of both positive and negative candlesticksconst figureWidth = 5.0// Green color fillingconst fillStylePositive = new SolidFill() .setColor( ColorRGBA( 0, 128, 0 ) )// Lime color fillingconst fillStyleHighlightPositive = new SolidFill() .setColor( ColorRGBA (0, 255, 0) )// Black color strokeconst bodyStrokeStyle = new SolidLine() .setFillStyle( new SolidFill().setColor( ColorRGBA( 0, 0, 0 ) ) ) .setThickness( 1.0 )// Green color strokeconst strokeStylePositive = new SolidLine() .setFillStyle( new SolidFill().setColor( ColorRGBA( 0, 128, 0 ) ) )// Lime color strokeconst strokeStylePositiveHighlight = new SolidLine() .setFillStyle( new SolidFill().setColor( ColorRGBA( 0, 240, 0 ) ) )ohlcSeries // Setting width of figures .setFigureWidth ( figureWidth ) // Styling positive candlestick .setPositiveStyle ( ( candlestick ) => candlestick // Candlestick body fill style .setBodyFillStyle( fillStylePositive ) // Candlestick body fill style when highlighted .setBodyFillStyleHighlight( fillStyleHighlightPositive ) // Candlestick body stroke style .setBodyStrokeStyle( bodyStrokeStyle ) // Candlestick stroke style .setStrokeStyle( strokeStylePositive ) // Candlestick stroke style when highlighted .setStrokeStyleHighlight( strokeStylePositiveHighlight ) ) // Styling negative candlestick .setNegativeStyle( ( candlestick ) => candlestick // etc ... )
=====================================================
如果你想LightningChart JS应用于商业用途,欢迎咨询在线客服。

标签:
声明:本站部分文章及图片源自用户投稿,如本站任何资料有侵权请您尽早请联系jinwei@zod.com.cn进行处理,非常感谢!