*这么优秀的国产工具怎能错过呢!在线下单专享“一口价”,立即购买!想要获取更多福利的朋友可以咨询在线客服哦~
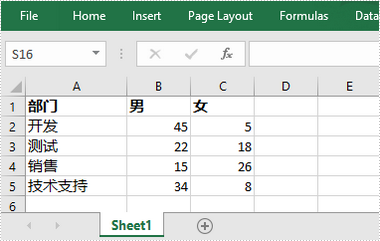
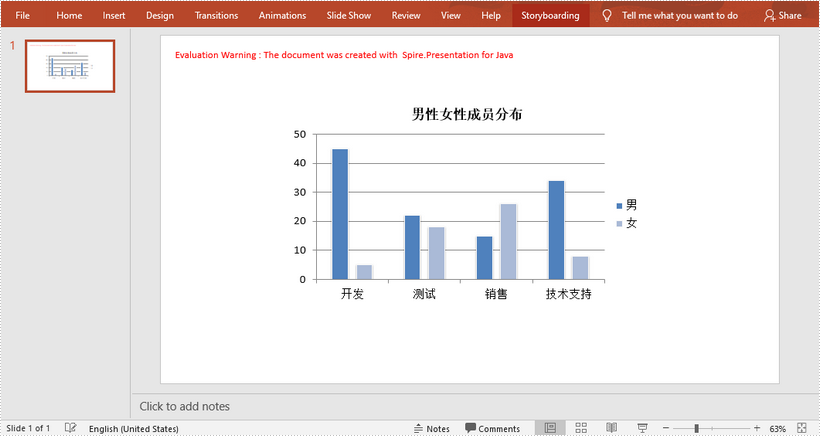
在Java中使用现有 Excel 数据创建 PowerPoint 图表
Excel文档截图:

import com.spire.presentation.FileFormat;import com.spire.presentation.Presentation;import com.spire.presentation.SlideSizeType;import com.spire.presentation.charts.ChartStyle;import com.spire.presentation.charts.ChartType;import com.spire.presentation.charts.IChart;import com.spire.xls.Workbook;import com.spire.xls.Worksheet;import java.awt.geom.Rectangle2D;public class CreateChartFromExcelData { public static void main(String[] args) throws Exception { //创建Presentation对象 Presentation presentation = new Presentation(); presentation.getSlideSize().setType(SlideSizeType.SCREEN_16_X_9); //添加柱状图 Rectangle2D rect = new Rectangle2D.Float(200, 100, 550, 320); IChart chart = presentation.getSlides().get(0).getShapes().appendChart(ChartType.COLUMN_CLUSTERED,rect); //清除默认图表数据 chart.getChartData().clear(0,0,5,5 ); //创建Workbook对象并加载Excel文档 Workbook wb = new Workbook(); wb.loadFromFile("C:\Users\Administrator\Desktop\data.xlsx"); //获取第一个工作表 Worksheet sheet = wb.getWorksheets().get(0); //将Excel中的数据导入图表数据表 for (int r = 0; r < sheet.getAllocatedRange().getRowCount(); r++) { for (int c = 0; c < sheet.getAllocatedRange().getColumnCount(); c++) { chart.getChartData().get(r,c).setValue(sheet.getCellRange(r+1, c+1).getValue2()); } } //添加标题 chart.getChartTitle().getTextProperties().setText("男性女性成员分布"); chart.getChartTitle().getTextProperties().isCentered(true); chart.getChartTitle().setHeight(25f); chart.hasTitle(true); //设置系列标签 chart.getSeries().setSeriesLabel(chart.getChartData().get("B1","C1")); //设置分类标签 chart.getCategories().setCategoryLabels(chart.getChartData().get("A2","A5")); //设置系列数据 chart.getSeries().get(0).setValues(chart.getChartData().get("B2","B5")); chart.getSeries().get(1).setValues(chart.getChartData().get("C2", "C5")); //应用内置样式 chart.setChartStyle(ChartStyle.STYLE_11); //设置系列重叠 chart.setOverLap(-50); //设置分类间距 chart.setGapWidth(200); //保存文档 presentation.saveToFile("output/Chart-CN.pptx", FileFormat.PPTX_2013); }}
是E-iceblue官方友好合作伙伴,如果您对spire.office,可以联系在线客服了解具体授权价格和使用机制。
标签:
声明:本站部分文章及图片源自用户投稿,如本站任何资料有侵权请您尽早请联系jinwei@zod.com.cn进行处理,非常感谢!