TeeChart提供5个轴与数据系列,Left,Right,Top,Bottom和Depth相关联。
下载TeeChart Pro ActiveX最新版本
(一)附加轴
1.1 复制轴
TeeChart提供5个轴与数据系列,Left,Right,Top,Bottom和Depth相关联。向图表添加新系列时,可以定义系列应与哪些轴相关(转到“Series”选项卡“General”页面)。您可以使用Axis Customdraw方法在图表上的任何位置重复前4轴中的任何一个(或全部)。请注意,此方法会复制Axis,但不会添加新的自定义轴。
例:
'fill the Series for this example with random dataPrivate Sub Command1_Click()Dim t As Integer For t = 0 To 20 TChart1.Series(0).AddXY t, ((100 * Rnd) + 1) - ((Rnd * 70) + 1), "", vbRed Next tEnd Sub'Put this code in the TChart1_OnBeforeDrawSeries() event:Dim posaxis As Integer With TChart1 If .Axis.Left.Maximum > 0 Then 'When scrolling or on zoom always keep the gridlines enclosed in the Chart rectangle .Canvas.ClipRectangle .Canvas.Left, .Canvas.Top, (.Canvas.Left + .Canvas.Width), _ (.Canvas.Top + .Canvas.Height) 'Always draw the 2nd vertical Axis at the middle point of the Chart posaxis = (.Canvas.Left) + (.Canvas.Width * 0.5) .Axis.Left.CustomDraw posaxis - 10, posaxis - 20, posaxis, True 'Draw the 2nd Horizontal axis at the level of "10" on the vertical axis posaxis = (.Axis.Left.CalcYPosValue(10)) .Axis.Bottom.CustomDraw posaxis + 10, posaxis + 40, posaxis, True .Canvas.UnClipRectangle End If End With
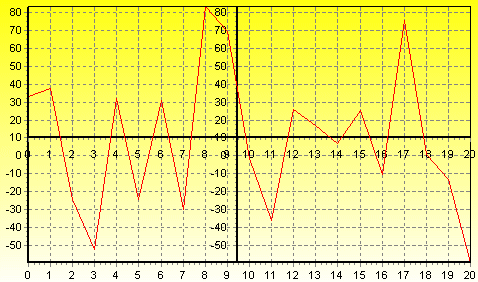

自定义轴
在此示例中,TeeChart将绘制新轴,一个水平,一个垂直位于图表的中心。当您滚动图表(用鼠标右键拖动)时,新的垂直轴将始终保持在图表的中心,新的水平轴将垂直滚动上下移动。新轴是默认轴的精确副本。
1.2 多个自定义轴
通过代码,例:
Private Sub Command1_Click()TChart1.Series(0).VerticalAxisCustom = TChart1.Axis.AddCustom(False)'You can modify any property of the new created axes, such as the axis color or axis titleWith TChart1.Axis.Custom(0) .AxisPen.Color = vbGreen .Title.Caption = "Extra axis" .Title.Font.Bold = True .Title.Angle = 90 .PositionPercent = 50 'percentage of Chart rectangleEnd WithEnd Sub
然后,您可以使用StartPosition和EndPosition属性将新轴与图表的整体关系定位。
StartPosition=50EndPosition=100
这些数字表示为图表矩形的百分比,其中0(零)(在垂直轴的情况下)为Top。这些属性可以应用于标准轴,以在图表中创建完全分区的“SubCharts”,例:
With TChart1.Axis.Left .StartPosition = 0 .EndPosition = 50 .Title.Caption = "1st Left Axis" .Title.Font.Bold = TrueEnd With
以上2个编码示例与以下数据结合使用:
For t = 0 To 10 TChart1.Series(0).AddXY t, 10 + t, "", clTeeColor If t > 1 Then TChart1.Series(1).AddXY t, t / 2, "", clTeeColor End IfNext t
将显示以下图表:
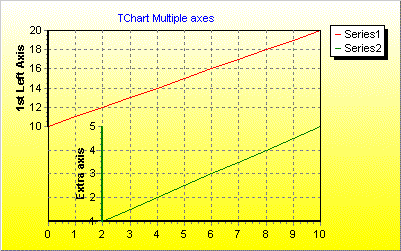
多轴
(二)轴事件
Axis事件提供运行时灵活性,可以修改Axis标签并在Axis Clicks上显示用户交互性。
OnClickAxis
例:
Private Sub TChart1_OnClickAxis(ByVal Axis As Long, ByVal Button As TeeChart.EMouseButton, ByVal Shift As TeeChart.EShiftState, ByVal X As Long, ByVal Y As Long)'Shows Axis point clicked when click on Bottom Axis.If Axis = atBottom Then MsgBox "Clicked Bottom Axis at " & TChart1.Axis.Bottom.CalcPosPoint(X)End IfEnd Sub
OnGetAxisLabel
可用于修改Axis标签,例:
Private Sub TChart1_OnGetAxisLabel(ByVal aAxis As Long, ByVal SeriesIndex As Long, ByVal ValueIndex As Long, LabelText As String)'Add following text to Bottom Axis LabelsIf aAxis = atBottom Then LabelText = "Period " + LabelTextEnd IfEnd Sub
OnGetNextAxisLabel
可用于决定应显示哪些轴标签,使用MoreLabels Boolean属性来包含/排除轴标签,例:
Private Sub TChart1_OnGetNextAxisLabel(ByVal Axis As Long, ByVal LabelIndex As Long, LabelValue As Double, MoreLabels As Boolean)If Axis = atBottom Then MoreLabels = True 'Only label if following cases are true Select Case LabelIndex Case 0: LabelValue = 11 Case 1: LabelValue = 19 Case 2: LabelValue = 23 Case Else: MoreLabels = False End SelectEnd IfEnd Sub
购买TeeChart Pro AciveX正版授权,请点击“咨询在线客服”哟!
标签:图表ActiveXteechart
声明:本站部分文章及图片源自用户投稿,如本站任何资料有侵权请您尽早请联系jinwei@zod.com.cn进行处理,非常感谢!