调色板是的一个子类图,用于显示多个零件表示可以被拖动到正在由用户修改的示图。一个的初始化调色板就像任何的初始化图。像图表一样,您可以在页面上同时拥有多个调色板。
GoJS是一款功能强大,快速且轻量级的流程图控件,可帮助你在JavaScript 和HTML5 Canvas程序中创建流程图,且极大地简化您的JavaScript / Canvas 程序。
GoJS最新试用版
调色板是的一个子类图,用于显示多个零件表示可以被拖动到正在由用户修改的示图。一个的初始化调色板就像任何的初始化图。像图表一样,您可以在页面上同时拥有多个调色板。
以下代码在下面的右侧初始化了一个空的Diagram。请注意,Diagram.allowDrop必须为true,现在默认情况下为true。在此示例中,我们无需费心用任何节点数据初始化模型。
该代码还以与任何Diagram相同的方式创建了两个Palette。您初始化组件面板的模型以显示该组件面板中的节点。
diagram.nodeTemplate = $(go.Node, "Auto", $(go.Shape, "RoundedRectangle", { fill: "white" }, new go.Binding("fill", "color"), { portId: "", fromLinkable: true, toLinkable: true, cursor: "pointer" }), $(go.TextBlock, { margin: 5 }, new go.Binding("text", "key")) ); diagram.undoManager.isEnabled = true; // create the Palette var myPalette = $(go.Palette, "myPaletteDiv"); // the Palette's node template is different from the main Diagram's myPalette.nodeTemplate = $(go.Node, "Horizontal", $(go.Shape, { width: 14, height: 14, fill: "white" }, new go.Binding("fill", "color")), $(go.TextBlock, new go.Binding("text", "color")) ); // the list of data to show in the Palette myPalette.model.nodeDataArray = [ { key: "C", color: "cyan" }, { key: "LC", color: "lightcyan" }, { key: "A", color: "aquamarine" }, { key: "T", color: "turquoise" }, { key: "PB", color: "powderblue" }, { key: "LB", color: "lightblue" }, { key: "LSB", color: "lightskyblue" }, { key: "DSB", color: "deepskyblue" } ]; // create the Palette var myPalette2 = $(go.Palette, "myPaletteDiv2", { // customize the GridLayout to align the centers of the locationObjects layout: $(go.GridLayout, { alignment: go.GridLayout.Location }) }); // the Palette's node template is different from the main Diagram's myPalette2.nodeTemplate = $(go.Node, "Vertical", { locationObjectName: "TB", locationSpot: go.Spot.Center }, $(go.Shape, { width: 20, height: 20, fill: "white" }, new go.Binding("fill", "color")), $(go.TextBlock, { name: "TB" }, new go.Binding("text", "color")) ); // the list of data to show in the Palette myPalette2.model.nodeDataArray = [ { key: "IR", color: "indianred" }, { key: "LC", color: "lightcoral" }, { key: "S", color: "salmon" }, { key: "DS", color: "darksalmon" }, { key: "LS", color: "lightsalmon" } ];
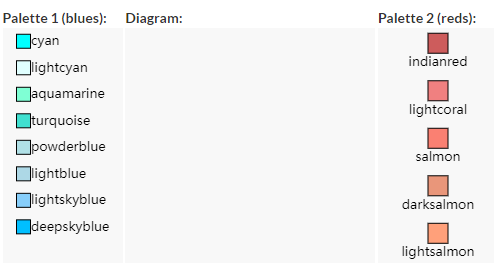

首先,请注意,尽管两个调色板都已使用相同类型的模型数据初始化,但是调色板中的项目外观不同,因为两者使用的节点模板不同。
此外,当您从任一侧的面板中将零件拖动到中间的图表中时,外观会发生变化,因为图表使用了第三个节点模板。 被拖动的只是模型数据,而不是实际的Node。 因为每个图都可以使用其自己的模板,所以可以完全不同地表示相同的数据对象。
如果您希望组件面板显示与主图表完全相同的相同节点的相同数据,则可以让它共享主图表的模板:
myPalette.nodeTemplateMap = myDiagram.nodeTemplateMap;
因为Palette继承自Diagram,所以您可以按常规方式自定义它。如果希望其零件小于或大于正常,则可以决定设置其Diagram.initialScale。
自定义调色板中零件的顺序也很普遍。调色板的layout属性是GridLayout,因此您可以将其GridLayout.sorting属性以及需要时将其GridLayout.comparer属性设置为自定义排序功能。例如,如果您希望组件面板以完全相同的顺序显示它们在零件中出现的顺序myPalette.model.nodeDataArray:
myPalette.layout.sorting = go.GridLayout.Forward;
如果要根据模型数据上的某些属性对组件面板中的零件进行排序:
myPalette.layout.comparer = function(a, b) { // A and B are Parts var av = a.data.someProp; var bv = b.data.someProp; if (av < bv) return -1; if (av > bv) return 1; return 0; };
====================================================
想要购买GoJS正版授权的朋友可以咨询官方客服

标签:
声明:本站部分文章及图片源自用户投稿,如本站任何资料有侵权请您尽早请联系jinwei@zod.com.cn进行处理,非常感谢!