StocQt应用呈现纳斯达克100股票列表的第一个股票的走势图。它允许用户从列表中选择另一种股票,并使用从离线数据集中获取所需数据XMLHttpRequest。
Qt quick演示-StocQt
Qt组件推荐:
- QtitanRibbon| 下载试用: 遵循Microsoft Ribbon UI Paradigm for Qt技术的Ribbon UI组件,致力于为Windows、Linux和Mac OS X提供功能完整的Ribbon组件。
- QtitanChart | 下载试用 :是一个C ++库,代表一组控件,这些控件使您可以快速地为应用程序提供漂亮而丰富的图表。并且支持所有主要的桌面
NASDAQ-100的可配置库存图表。
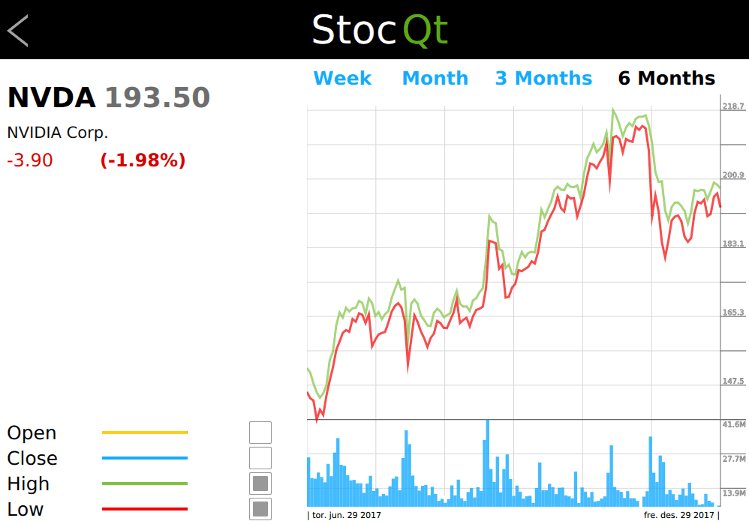

StocQt应用呈现纳斯达克100股票列表的第一个股票的走势图。它允许用户从列表中选择另一种股票,并使用从离线数据集中获取所需数据XMLHttpRequest。
该应用程序使用几种自定义类型,例如Button,CheckBox,StockChart,StockInfo,StockView等。这些类型用于以可读形式显示库存数据,还可以让用户自定义趋势图。例如,用户可以选择查看股票价格的每周,每月,每季度或半年趋势。
该应用程序使用ObjectModel类型来访问它依赖的两个可视数据模型。
ListView { id: root ... model: ObjectModel { StockListView { id: listView width: root.width height: root.height } StockView { id: stockView width: root.width height: root.height stocklist: listView stock: stock } } }
StockListView模型是一个静态数据模型,该模型列出了NASDAQ-100股票,其中包含基本信息,例如stockId,名称,价值,更改等。如果用户要从列表中选择另一只股票,则应用程序将使用此数据模型。
StockView是一个复杂的数据模型,可显示所选股票的趋势图。它使用另一种自定义类型StockChart,它使用Canvas呈现股票价格的图形趋势。在应用程序的生命周期中,大部分时间都使用此数据模型。
Rectangle { id: chart ... Canvas { id: canvas ... onPaint: { numPoints = stockModel.indexOf(chart.startDate); if (chart.gridSize == 0) chart.gridSize = numPoints var ctx = canvas.getContext("2d"); ctx.globalCompositeOperation = "source-over"; ctx.lineWidth = 1; drawBackground(ctx); if (!stockModel.ready) { drawError(ctx, "No data available."); return; } var highestPrice = 0; var highestVolume = 0; var lowestPrice = -1; var points = []; for (var i = numPoints, j = 0; i >= 0 ; i -= pixelSkip, j += pixelSkip) { var price = stockModel.get(i); if (parseFloat(highestPrice) < parseFloat(price.high)) highestPrice = price.high; if (parseInt(highestVolume, 10) < parseInt(price.volume, 10)) highestVolume = price.volume; if (lowestPrice < 0 || parseFloat(lowestPrice) > parseFloat(price.low)) lowestPrice = price.low; points.push({ x: j * xGridStep, open: price.open, close: price.close, high: price.high, low: price.low, volume: price.volume }); } if (settings.drawHighPrice) drawPrice(ctx, 0, numPoints, settings.highColor, "high", points, highestPrice, lowestPrice); if (settings.drawLowPrice) drawPrice(ctx, 0, numPoints, settings.lowColor, "low", points, highestPrice, lowestPrice); if (settings.drawOpenPrice) drawPrice(ctx, 0, numPoints,settings.openColor, "open", points, highestPrice, lowestPrice); if (settings.drawClosePrice) drawPrice(ctx, 0, numPoints, settings.closeColor, "close", points, highestPrice, lowestPrice); drawVolume(ctx, 0, numPoints, settings.volumeColor, "volume", points, highestVolume); drawScales(ctx, highestPrice, lowestPrice, highestVolume); } } Text { id: fromDate color: "#000000" font.family: Settings.fontFamily font.pointSize: 8 Layout.alignment: Qt.AlignLeft text: "| " + startDate.toDateString() } Text { id: toDate color: "#000000" font.family: Settings.fontFamily font.pointSize: 8 Layout.alignment: Qt.AlignRight Layout.rightMargin: canvas.tickMargin Layout.columnSpan: 5 text: endDate.toDateString() + " |" } }}
为了更好地了解应用程序,请使用Qt Creator浏览其代码。
====================================================
想要了解或购买Qt正版授权的朋友,欢迎咨询官方客服
Qt技术交流群现已开通,QQ搜索群 “765444821”或者扫描下方二维码即可加入


标签:
声明:本站部分文章及图片源自用户投稿,如本站任何资料有侵权请您尽早请联系jinwei@zod.com.cn进行处理,非常感谢!