Web图表控件ChartDirector连载教程分享之3D散点图,内附下载和链接。
ChartDirector是一个非常理想的图表工具,它拥有广泛的图表类型、分层架构、实时互动的大数据表、普遍适应于各种应用程序以及支持PDF和SVG图标等的优点。此系列连载旨在介绍ChartDirector的实用教程,供大家学习讨论。
一、3D散点图(1)
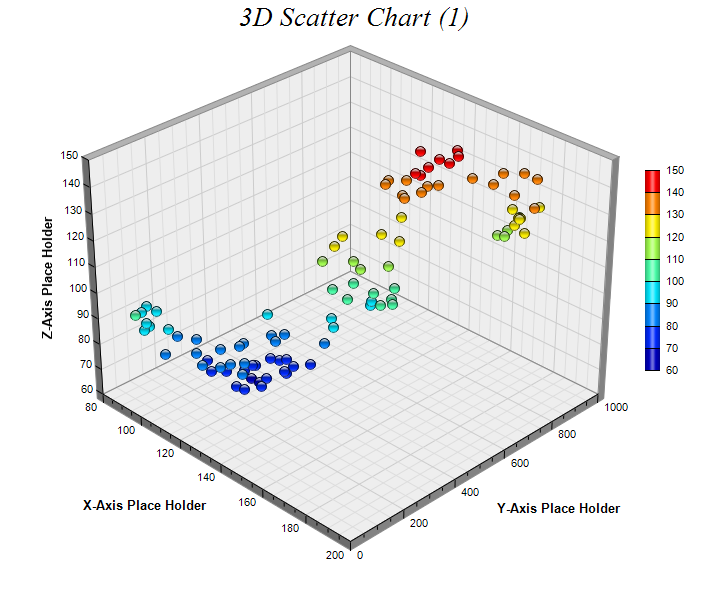

此示例演示了创建3D散点图的基本步骤:
- 使用ThreeDScatterChart.ThreeDScatterChart创建ThreeDScatterChart对象。
- 使用ThreeDChart.setPlotRegion指定绘图区域的位置和大小。
- 使用ThreeDScatterChart.addScatterGroup将散点图组添加到图表。在此示例中,符 颜色设置为SameAsMainColor,即颜色取决于z坐标。根据颜色轴(颜色图例),可以使用ThreeDChart.colorAxis访问颜色轴。
- 使用ThreeDChart.setColorAxis设置颜色轴(颜色图例)的位置。
- 使用BaseChart.addTitle和Axis.setTitle添加图表和轴标题。
- 使用图表生成BaseChartmakeChart。
源代码清单:
以下代码可在“cppdemo / threedscatter”中找到。Mf版本的代码可在“mfcdemo / mfcdemo”中找到(仅限Windows版本)。QT版本的代码可在“qtdemo / qtdemo”中找到。
#include "chartdir.h"int main(int argc, char *argv[]){ // The XYZ data for the 3D scatter chart as 3 random data series RanSeries *r = new RanSeries(0); DoubleArray xData = r->getSeries(100, 100, -10, 10); DoubleArray yData = r->getSeries(100, 0, 0, 20); DoubleArray zData = r->getSeries(100, 100, -10, 10); // Create a ThreeDScatterChart object of size 720 x 600 pixels ThreeDScatterChart *c = new ThreeDScatterChart(720, 600); // Add a title to the chart using 20 points Times New Roman Italic font c->addTitle("3D Scatter Chart (1) ", "timesi.ttf", 20); // Set the center of the plot region at (350, 280), and set width x depth x height to 360 x 360 // x 270 pixels c->setPlotRegion(350, 280, 360, 360, 270); // Add a scatter group to the chart using 11 pixels glass sphere symbols, in which the color // depends on the z value of the symbol c->addScatterGroup(xData, yData, zData, "", Chart::GlassSphere2Shape, 11, Chart::SameAsMainColor ); // Add a color axis (the legend) in which the left center is anchored at (645, 270). Set the // length to 200 pixels and the labels on the right side. c->setColorAxis(645, 270, Chart::Left, 200, Chart::Right); // Set the x, y and z axis titles using 10 points Arial Bold font c->xAxis()->setTitle("X-Axis Place Holder", "arialbd.ttf", 10); c->yAxis()->setTitle("Y-Axis Place Holder", "arialbd.ttf", 10); c->zAxis()->setTitle("Z-Axis Place Holder", "arialbd.ttf", 10); // Output the chart c->makeChart("threedscatter.png"); //free up resources delete r; delete c; return 0;}
二、3D散点图(2)
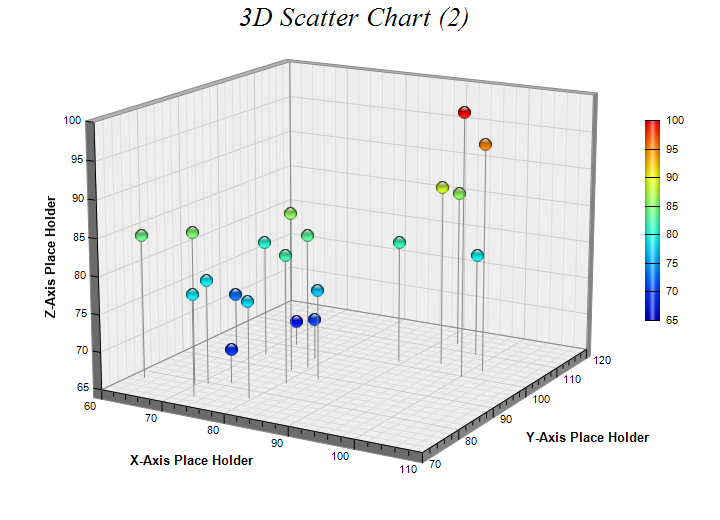
此示例通过包含下划线,使用替代视角和连续着色来扩展3D散点图(1)示例。
下拉线是从数据点下降到XY平面的线。它们有助于可视化点的“高度”(z坐标),如果没有太多数据点,则可能很有用。
- 使用ThreeDChart.setViewAngle设置备用视角。
- 使用ThreeDScatterGroup.setDropLine添加下拉线。
- 使用ColorAxis.setColorGradient配置连续着色。
源代码清单:
以下代码可在“cppdemo / threedscatter”中找到。Mf版本的代码可在“mfcdemo / mfcdemo”中找到(仅限Windows版本)。QT版本的代码可在“qtdemo / qtdemo”中找到。
#include "chartdir.h"int main(int argc, char *argv[]){ // The XYZ data for the 3D scatter chart as 3 random data series RanSeries *r = new RanSeries(3); DoubleArray xData = r->getSeries(20, 100, -10, 10); DoubleArray yData = r->getSeries(20, 100, -10, 10); DoubleArray zData = r->getSeries(20, 100, -10, 10); // Create a ThreeDScatterChart object of size 720 x 520 pixels ThreeDScatterChart *c = new ThreeDScatterChart(720, 520); // Add a title to the chart using 20 points Times New Roman Italic font c->addTitle("3D Scatter Chart (2) ", "timesi.ttf", 20); // Set the center of the plot region at (350, 240), and set width x depth x height to 360 x 360 // x 270 pixels c->setPlotRegion(350, 240, 360, 360, 270); // Set the elevation and rotation angles to 15 and 30 degrees c->setViewAngle(15, 30); // Add a scatter group to the chart using 13 pixels glass sphere symbols, in which the color // depends on the z value of the symbol ThreeDScatterGroup *g = c->addScatterGroup(xData, yData, zData, "", Chart::GlassSphere2Shape, 13, Chart::SameAsMainColor); // Add grey (888888) drop lines to the symbols g->setDropLine(0x888888); // Add a color axis (the legend) in which the left center is anchored at (645, 220). Set the // length to 200 pixels and the labels on the right side. Use smooth gradient coloring. c->setColorAxis(645, 220, Chart::Left, 200, Chart::Right)->setColorGradient(); // Set the x, y and z axis titles using 10 points Arial Bold font c->xAxis()->setTitle("X-Axis Place Holder", "arialbd.ttf", 10); c->yAxis()->setTitle("Y-Axis Place Holder", "arialbd.ttf", 10); c->zAxis()->setTitle("Z-Axis Place Holder", "arialbd.ttf", 10); // Output the chart c->makeChart("threedscatter2.png"); //free up resources delete r; delete c; return 0;}
更多实用教程将会以连载的形式展现,敬请关注~
想要购买ChartDirector正版授权,或者获取更多该产品相关信息的朋友可以点击” 咨询在线客服 “~
海量产品正在参加年终大促,价格优惠!详情请点击” 年终巅峰钜惠 “~
标签:Web图表交互图表
声明:本站部分文章及图片源自用户投稿,如本站任何资料有侵权请您尽早请联系jinwei@zod.com.cn进行处理,非常感谢!