Web图表控件ChartDirector连载教程分享之条形图描影,内附下载和链接。
ChartDirector是一个非常理想的图表工具,它拥有广泛的图表类型、分层架构、实时互动的大数据表、普遍适应于各种应用程序以及支持PDF和SVG图标等的优点。此系列连载旨在介绍ChartDirector的实用教程,供大家学习讨论。
柔性条形图描影
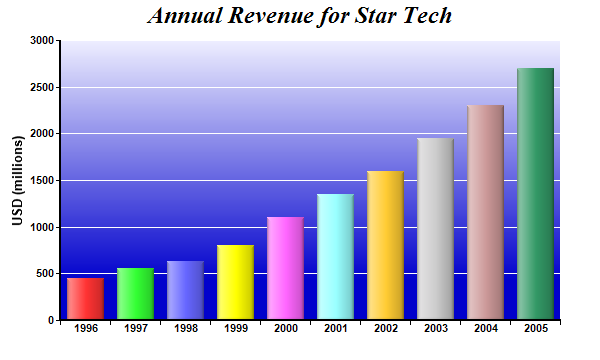

此示例演示了条形图的柔性光照效果、绘图区域背景的渐变颜色以及在轴标签之间放置轴刻度。
柔和的灯光是一种特殊的阴影效果,看起来像渐变色。在该示例中,柔和的照明效果被用到条行图上,光从左边方向发出。具体方法是:
- 通过使用BaseChart.linearGradientColor定义渐变颜色来配置渐变绘图区域背景,然后使用XYChart.setPlotArea将其应用于绘图区域。
- 该XYChart.setPlotArea还设置绘图区边框和 格线的颜色为白色。
- 条形图的柔和光照效果使用Chart::softLighting定义,然后使用Layer.setBorderColor应用于条形图。
- 使用Axis.setTickOffset,在此示例中,刻度线偏移0.5个单位。因此,它们不与轴标签对齐,而是位于标签之间。
源代码清单
以下代码可在“cppdemo / softlightbar”中找到。MFC版本的代码可在“mfcdemo”中找到(仅限Windows版本)。QT版本的代码可在“qtdemo”中找到。
#include "chartdir.h"int main(int argc, char *argv[]){ // The data for the bar chart double data[] = {450, 560, 630, 800, 1100, 1350, 1600, 1950, 2300, 2700}; // The labels for the bar chart const char *labels[] = {"1996", "1997", "1998", "1999", "2000", "2001", "2002", "2003", "2004", "2005"}; // Create a XYChart object of size 600 x 360 pixels XYChart *c = new XYChart(600, 360); // Add a title to the chart using 18pt Times Bold Italic font c->addTitle("Annual Revenue for Star Tech", "timesbi.ttf", 18); // Set the plotarea at (60, 40) and of size 500 x 280 pixels. Use a vertical gradient color from // light blue (eeeeff) to deep blue (0000cc) as background. Set border and grid lines to white // (ffffff). c->setPlotArea(60, 40, 500, 280, c->linearGradientColor(60, 40, 60, 280, 0xeeeeff, 0x0000cc), -1, 0xffffff, 0xffffff); // Add a multi-color bar chart layer using the supplied data. Use soft lighting effect with // light direction from left. c->addBarLayer(DoubleArray(data, (int)(sizeof(data) / sizeof(data[0]))), IntArray(0, 0) )->setBorderColor(Chart::Transparent, Chart::softLighting(Chart::Left)); // Set x axis labels using the given labels c->xAxis()->setLabels(StringArray(labels, (int)(sizeof(labels) / sizeof(labels[0])))); // Draw the ticks between label positions (instead of at label positions) c->xAxis()->setTickOffset(0.5); // Add a title to the y axis with 10pt Arial Bold font c->yAxis()->setTitle("USD (millions)", "arialbd.ttf", 10); // Set axis label style to 8pt Arial Bold c->xAxis()->setLabelStyle("arialbd.ttf", 8); c->yAxis()->setLabelStyle("arialbd.ttf", 8); // Set axis line width to 2 pixels c->xAxis()->setWidth(2); c->yAxis()->setWidth(2); // Output the chart c->makeChart("softlightbar.png"); //free up resources delete c; return 0;}
玻璃型条形图描影

此示例演示了条形图的玻璃着色效果、绘图区域背景的渐变颜色以及绘图区域两侧的轴标签。
玻璃型描影是一种复杂的阴影效果,可以实现有色玻璃或半透明塑料材料的外观和感觉。这种效应涉及材料内部反射和折射引起的眩光和光照变化。具体方法如下:
- 通过使用BaseChart.linearGradientColor定义渐变颜色来配置绘图区域背景,然后使用XYChart.setPlotArea将其应用于绘图区域。
- 该XYChart.setPlotArea还设置绘图区域边框和 格线的颜色为白色。
- 条形图的玻璃描影效果使用Chart::glassEffect定义,然后使用Layer.setBorderColor应用于条形图。
- XYChart.syncYAxis用于在绘图区域的两侧显示两个同步的y轴。
- Axis.setColors用于将y轴设置为“Transparent”,因此只有轴标签可见。
- 使用Axis.setLabelStyle将轴标签字体设置为Arial Bold。
源代码清单
以下代码可在“cppdemo / glasslightbar”中找到。MFC版本的代码可在“mfcdemo”中找到(仅限Windows版本)。QT版本的代码可在“qtdemo”中找到。
#include "chartdir.h"int main(int argc, char *argv[]){ // The data for the bar chart double data[] = {450, 560, 630, 800, 1100, 1350, 1600, 1950, 2300, 2700}; // The labels for the bar chart const char *labels[] = {"1996", "1997", "1998", "1999", "2000", "2001", "2002", "2003", "2004", "2005"}; // Create a XYChart object of size 600 x 360 pixels XYChart *c = new XYChart(600, 360); // Set the plotarea at (60, 40) and of size 480 x 280 pixels. Use a vertical gradient color from // light blue (eeeeff) to deep blue (0000cc) as background. Set border and grid lines to white // (ffffff). c->setPlotArea(60, 40, 480, 280, c->linearGradientColor(60, 40, 60, 280, 0xeeeeff, 0x0000cc), -1, 0xffffff, 0xffffff); // Add a title to the chart using 18pt Times Bold Italic font c->addTitle("Annual Revenue for Star Tech", "timesbi.ttf", 18); // Add a multi-color bar chart layer using the supplied data. Use glass lighting effect with // light direction from the left. c->addBarLayer(DoubleArray(data, (int)(sizeof(data) / sizeof(data[0]))), IntArray(0, 0) )->setBorderColor(Chart::Transparent, Chart::glassEffect(Chart::NormalGlare, Chart::Left)); // Set the x axis labels c->xAxis()->setLabels(StringArray(labels, (int)(sizeof(labels) / sizeof(labels[0])))); // Show the same scale on the left and right y-axes c->syncYAxis(); // Set the left y-axis and right y-axis title using 10pt Arial Bold font c->yAxis()->setTitle("USD (millions)", "arialbd.ttf", 10); c->yAxis2()->setTitle("USD (millions)", "arialbd.ttf", 10); // Set all axes to transparent c->xAxis()->setColors(Chart::Transparent); c->yAxis()->setColors(Chart::Transparent); c->yAxis2()->setColors(Chart::Transparent); // Set the label styles of all axes to 8pt Arial Bold font c->xAxis()->setLabelStyle("arialbd.ttf", 8); c->yAxis()->setLabelStyle("arialbd.ttf", 8); c->yAxis2()->setLabelStyle("arialbd.ttf", 8); // Output the chart c->makeChart("glasslightbar.png"); //free up resources delete c; return 0;}
想要购买ChartDirector正版授权,或者获取更多该产品相关信息的朋友可以点击” 咨询在线客服 “~
海量产品正在参加年终大促,价格优惠!详情请点击” 年终巅峰钜惠 “~
标签:Web图表交互图表
声明:本站部分文章及图片源自用户投稿,如本站任何资料有侵权请您尽早请联系jinwei@zod.com.cn进行处理,非常感谢!