

TeeChart for .NET是优秀的工业4.0 WinForm图表控件,官方独家授权汉化,集功能全面、性能稳定、价格实惠等优势于一体。TeeChart for .NET 中文版还可让您在使用和学习上没有任何语言障碍,至少可以节省30%的开发时间。
TeeChart for .NET最新版下载
在TeeChar系列教程中,上一章我们主要讲解了如何实现图表分页,今天我们继续为大家讲解“轴控制的实现(上)”。
TeeChart Pro将自动为你定义所有轴的标签,并提供足够的灵活性来定制你可能有的任何具体要求。TeeChart Pro提供真正的多轴。这些都可以在设计或运行时使用,为轴的定义提供了无数的可能性和灵活性。
内容
轴控制 – 关键领域
- 尺寸
- 增量
- 标题
- 标签
- 刻度
- 轴的位置
附加轴
- 复制轴
- 多轴
轴事件
- OnClickAxis
- 获取轴标签
- 获取下一个轴的标签
轴控制 – 关键领域
尺度
当你将系列数据添加到你的图表中时,轴的刻度会自动设置。你可以在设计时或在运行时通过使用轴的属性来改变默认值。
非日期-时间数据
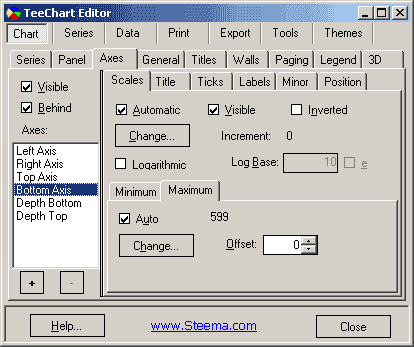
当添加一个新的系列时,TeeChart Editor的Axis Page的Scales部分将显示自动选择,其他选项为灰色。所有显示的数值都是数字。
自动选择最佳的轴刻度范围以适应你的数据。如果你把自动关闭,刻度部分将取消灰色选项,你可以改变轴的值。重要的是,记得从页面左边的坐标轴列表中选择你想配置的坐标轴。
[C#.Net] Random rnd = new Random(); for(int i = 0; i <= 40; ++i) line1.Add(Convert.ToDouble(i),rnd.Next(100),Color.Red); [VB.Net] Dim i As Integer For i = 0 To 40 Line1.Add(Convert.ToDouble(i), Rnd() * 100, Color.Red) Next i
Setting axis scales by code
你可以用这段代码在运行时改变最大和最小值。
[C#.Net] Steema.TeeChart.Axis bottomAxis = tChart1.Axes.Bottom; bottomAxis.Automatic = false; bottomAxis.Maximum = 36; bottomAxis.Minimum = 5; [VB.Net] With TChart1.Axes.Bottom .Automatic = False .Maximum = 36 .Minimum = 5 End With
你可以单独设置轴刻度的最大值和最小值为自动,例如:
[C#.Net] Steema.TeeChart.Axis bottomAxis = tChart1.Axes.Bottom; bottomAxis.AutomaticMaximum = true; bottomAxis.AutomaticMinimum = false; bottomAxis.Minimum = 5; [VB.Net] With TChart1.Axes.Bottom .AutomaticMaximum = True .AutomaticMinimum = False .Minimum = 5 End With
增量
您可以定制轴的区间。从轴页面的Scales部分选择Desired Increment组合框,添加你需要的增量。你可以在运行时通过代码来改变它。
[C#.Net] Steema.TeeChart.Axis bottomAxis = tChart1.Axes.Bottom; bottomAxis.Increment = 20; [VB.Net] With TChart1.Axes.Bottom .Increment = 20 End With
Datetime data
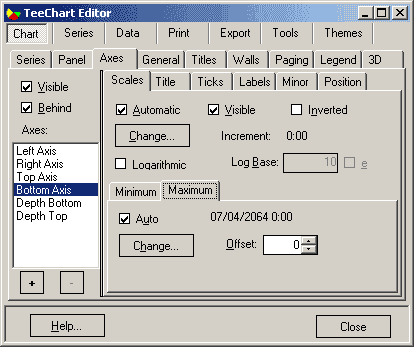
如果你的数据是数据时间(你可以通过进入系列,常规页面为你的系列设置数据为数据时间),图表->轴页面,刻度部分将显示数据时间范围。从 “期望的增量 “组合框中选择增量,并添加一些样本数据。
[C#.Net] Random rnd = new Random(); DateTime today = DateTime.Today; TimeSpan oneDay = TimeSpan.FromDays(1); line1.XValues.DateTime = true; for(int i = 1; i <= 25; ++i) line1.Add(today,rnd.Next(100),Color.Red); today += oneDay; [VB.Net] Dim i As Integer Dim Today As DateTime = DateTime.Today Dim OneDay As TimeSpan = TimeSpan.FromDays(1) Line1.XValues.DateTime = True For i = 1 To 25 Line1.Add(Today, Rnd() * 100, Color.Red) Today = Today.Add(OneDay) Next
在运行时改变增量。
[C#.Net] Steema.TeeChart.Axis bottomAxis = tChart1.Axes.Bottom; bottomAxis.Increment = Steema.TeeChart.Utils.GetDateTimeStep(Steema.TeeChart.DateTimeSteps.TwoDays); [VB.Net] With TChart1.Axes.Bottom .Increment = Steema.TeeChart.Utils.GetDateTimeStep(Steema.TeeChart.DateTimeSteps.TwoDays) End With
参见AxisLabels.ExactDateTime属性以了解更多关于日期轴标记的信息。
未完待续,请看图表控件TeeChart for .NET系列教程四:轴控制(中)
如果您想了解TeeChart for .NET价格,欢迎咨询在线客服
TeeChart for .NET 是优秀的工业4.0 WinForm图表控件,官方独家授权汉化,集功能全面、性能稳定、价格实惠等优势于一体。
TeeChart for .NET技术交流QQ群: 欢迎加入
标签:
声明:本站部分文章及图片源自用户投稿,如本站任何资料有侵权请您尽早请联系jinwei@zod.com.cn进行处理,非常感谢!