复制轴
TeeChart for .NET提供 5 个与数据系列相关联的轴:左、上、下、右和深度。当您将新系列添加到图表时,您可以定义系列应该与哪个轴相关(转到系列选项卡,常规页面)。您可以使用 Axis Customdraw 方法在图表上的任何位置重复前面 4 个轴中的任何一个(或全部)。请注意,此方法会复制您的轴,它不会添加新的自定义轴。有关详细信息,请参阅下一部分“多个自定义轴”。例子:
[C#.Net]private void Form1_Load(object sender, System.EventArgs e) Random Rnd = new Random(); tChart1.Aspect.View3D = false; tChart1.Panel.Gradient.Visible = true; for(int t = 0; t <= 20; ++t) line1.Add(t, ((Rnd.Next(100)) + 1) - ((Rnd.Next(70)) + 1), Color.Red); private void line1_BeforeDrawValues(object sender, Steema.TeeChart.Drawing.Graphics3D g) int posAxis = 0; if(tChart1.Axes.Left.Maximum > 0) tChart1.Axes.Left.Draw(g.ChartXCenter - 10,g.ChartXCenter - 20,g.ChartXCenter,true); posAxis = tChart1.Axes.Left.CalcYPosValue(10); tChart1.Axes.Bottom.Draw(posAxis + 10, posAxis + 40, posAxis, true); [VB.Net]Private Sub Form1_Load(ByVal sender As System.Object, ByVal e As System.EventArgs) Handles MyBase.Load Dim t As Integer TChart1.Aspect.View3D = False TChart1.Panel.Gradient.Visible = True For t = 0 To 20 Line1.Add(t, ((Rnd() * 100) + 1) - ((Rnd() * 70) + 1), Color.Red) Next End SubPrivate Sub Line1_BeforeDrawValues(ByVal sender As Object, ByVal g As Steema.TeeChart.Drawing.Graphics3D) Handles Line1.BeforeDrawValues Dim posAxis As Integer If TChart1.Axes.Left.Maximum > 0 Then TChart1.Axes.Left.Draw(g.ChartXCenter - 10, g.ChartXCenter - 20, g.ChartXCenter, True) posAxis = TChart1.Axes.Left.CalcYPosValue(10) TChart1.Axes.Bottom.Draw(posAxis + 10, posAxis + 40, posAxis, True) End IfEnd Sub
上面的示例代码将生成下图:
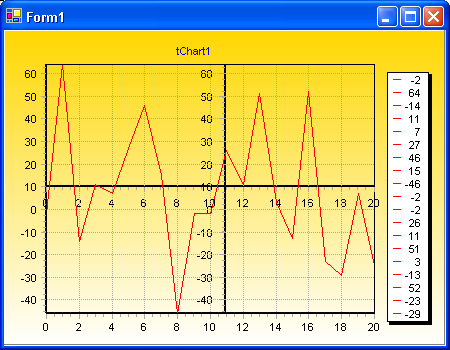

自定义轴:在此示例中,TeeChart 将在图表中心绘制新轴,一个水平轴和一个垂直轴。当您滚动图表(用鼠标右键拖动)时,新的垂直轴将始终保持在图表的中心,新的水平轴将随着垂直滚动上下移动。新轴是默认轴的精确副本。
多个自定义轴
Via Code[C#.Net]private void Form1_Load(object sender, System.EventArgs e) Line line1 = new Line(); Line line2 = new Line(); tChart1.Aspect.View3D = false; tChart1.Panel.Gradient.Visible = true; tChart1.Header.Text = "TeeChart Multiple Axes"; tChart1.Series.Add(line1); tChart1.Series.Add(line2); for(int t = 0; t <= 10; ++t) line1.Add(Convert.ToDouble(t), Convert.ToDouble(10 + t), Color.Red); if(t > 1) line2.Add(Convert.ToDouble(t), Convert.ToDouble(t), Color.Green); Axis leftAxis = tChart1.Axes.Left; leftAxis.StartPosition = 0; leftAxis.EndPosition = 50; leftAxis.AxisPen.Color = Color.Red; leftAxis.Title.Font.Color = Color.Red; leftAxis.Title.Font.Bold = true; leftAxis.Title.Text = "1st Left Axis";// You are able to then position the new Axis in overall relation to the Chart // by using the StartPosition and EndPosition properties.//// StartPosition=50// EndPosition=100//// These figures are expressed as percentages of the Chart Rectangle with 0 (zero)// (in the case of a vertical Axis) being Top. These properties can be applied to // the Standard Axes to create completely partitioned 'SubCharts' within the Chart. Axis axis1 = new Axis(false, false, tChart1.Chart); tChart1.Axes.Custom.Add(axis1); line2.CustomVertAxis = axis1; axis1.StartPosition = 50; axis1.EndPosition = 100; axis1.AxisPen.Color = Color.Green; axis1.Title.Font.Color = Color.Green; axis1.Title.Font.Bold = true; axis1.Title.Text = "Extra Axis"; axis1.PositionUnits= PositionUnits.Percent; axis1.RelativePosition = 20; [VB.Net]Private Sub Form1_Load(ByVal sender As System.Object, ByVal e As System.EventArgs) Handles MyBase.Load Dim Line1 As New Steema.TeeChart.Styles.Line() Dim Line2 As New Steema.TeeChart.Styles.Line() Dim t As Integer TChart1.Aspect.View3D = False TChart1.Panel.Gradient.Visible = True TChart1.Header.Text = "TeeChart Multiple Axes" TChart1.Series.Add(Line1) TChart1.Series.Add(Line2) For t = 0 To 10 Line1.Add(t, 10 + t, Color.Red) If (t > 1) Then Line2.Add(t, t, Color.Green) End If Next With TChart1.Axes.Left .StartPosition = 0 .EndPosition = 50 .AxisPen.Color = Color.Red .Title.Font.Color = Color.Red .Title.Font.Bold = True .Title.Text = "1st Left Axis" End With 'You are able to then position the new Axis in overall relation to the Chart 'by using the StartPosition and EndPosition properties. ' StartPosition = 50 ' EndPosition = 100 'These figures are expressed as percentages of the Chart Rectangle with 0 (zero) '(in the case of a vertical Axis) being Top. These properties can be applied to 'the Standard Axes to create completely partitioned 'SubCharts' within the Chart. Dim Axis1 As New Steema.TeeChart.Axis(False, False, TChart1.Chart) TChart1.Axes.Custom.Add(Axis1) Line2.CustomVertAxis = Axis1 Axis1.StartPosition = 50 Axis1.EndPosition = 100 Axis1.AxisPen.Color = Color.Green Axis1.Title.Font.Color = Color.Green Axis1.Title.Font.Bold = True Axis1.Title.Text = "Extra Axis" Axis1.PositionUnits.= PositionUnits.Percent; Axis1.RelativePosition = 20End Sub
上面的编码示例将显示以下图表:
多轴:选择是无限的!我们建议在使用自定义轴时要小心,因为很容易开始用新轴填充屏幕并忘记要管理哪个轴!
本次关于.NET图表控件TeeChart for .NET的教程就介绍到这里了,下一篇将介绍图例设计的相关内容。
如果您想了解TeeChart for .NET价格,欢迎咨询在线客服
TeeChart for .NET 是优秀的工业4.0 WinForm图表控件,官方独家授权汉化,集功能全面、性能稳定、价格实惠等优势于一体。
标签:
声明:本站部分文章及图片源自用户投稿,如本站任何资料有侵权请您尽早请联系jinwei@zod.com.cn进行处理,非常感谢!