ChartDirector 6.3(C ++版)教程分享——图标饼图
ChartDirector是一款使用方便快捷、功能非常强大且交互性强的通用Web图表组件。在Web服务器以及嵌入式应用程序开发中,ChartDirector是一个非常理想的图表工具,因为它拥有丰富的图表图形组件库。
一、图标饼图(一)


此示例演示如何使用CDML和参数替换格式化在扇区标签中包含图标。它还演示了渐变背景颜色,标题的玻璃着色效果和图表框的圆角。
-
渐变背景颜色使用Chart.metalColor创建,蓝色为基色,垂直方向。
-
使用BaseChart.setRoundedFrame配置圆角框架。
-
标题的玻璃着色效果使用Chart.glassEffect定义,然后使用标题TextBox对象的Box.setBackground应用于标题。
-
使用BaseChart.addExtraField将图标文件名作为额外字段添加到图表中。
-
扇区标签格式字符串使用CDML和参数替换格式指定为:
<* block,valign = absmiddle *> <* img = {field0} *> <* block *> {label} <* br *> {percent}%<* / *> <* / *>
这意味着扇区标签是一个块,其中包含一个图像,后跟另一个文本块。图像文件取自额外字段。文本块包含两行显示扇区名称和百分比。
-
格式字符串使用PieChart.setLabelFormat应用于图表。
-
对于Web应用程序,我们需要设置搜索路径以使用BaseChart.setSearchPath从当前脚本目录加载图标图像。这是因为对于某些Web服务器(例如IIS),默认的当前目录不是脚本目录(例如,IIS使用IIS可执行目录),因此需要显式设置搜索路径。
源代码清单
#include "chartdir.h"int main(int argc, char *argv[]){ // The data for the pie chart double data[] = {72, 18, 15, 12}; // The depths for the sectors double depths[] = {30, 20, 10, 10}; // The labels for the pie chart const char *labels[] = {"Sunny", "Cloudy", "Rainy", "Snowy"}; // The icons for the sectors const char *icons[] = {"sun.png", "cloud.png", "rain.png", "snowy.png"}; // Create a PieChart object of size 400 x 310 pixels, with a blue (CCCCFF) vertical metal // gradient background, black border, 1 pixel 3D border effect and rounded corners PieChart *c = new PieChart(400, 310, Chart::metalColor(0xccccff, 0), 0x000000, 1); c->setRoundedFrame(); // Set the center of the pie at (200, 180) and the radius to 100 pixels c->setPieSize(200, 180, 100); // Add a title box using 15pt Times Bold Italic font, on a blue (CCCCFF) background with glass // effect c->addTitle("Weather Profile in Wonderland", "timesbi.ttf", 15)->setBackground(0xccccff, 0x000000, Chart::glassEffect()); // Set the pie data and the pie labels c->setData(DoubleArray(data, (int)(sizeof(data) / sizeof(data[0]))), StringArray(labels, (int)( sizeof(labels) / sizeof(labels[0])))); // Add icons to the chart as a custom field c->addExtraField(StringArray(icons, (int)(sizeof(icons) / sizeof(icons[0])))); // Configure the sector labels using CDML to include the icon images c->setLabelFormat( "<*block,valign=absmiddle*><*img={field0}*> <*block*>{label}n{percent}%<*/*><*/*>"); // Draw the pie in 3D with variable 3D depths c->set3D(DoubleArray(depths, (int)(sizeof(depths) / sizeof(depths[0])))); // Set the start angle to 225 degrees may improve layout when the depths of the sector are // sorted in descending order, because it ensures the tallest sector is at the back. c->setStartAngle(225); // Output the chart c->makeChart("iconpie.png"); //free up resources delete c; return 0;}
二、图标饼图(二)
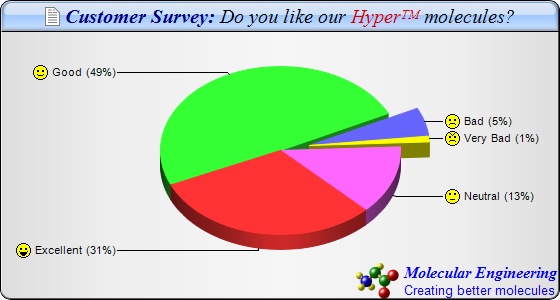
此示例扩展了Icon Pie Chart(1)示例,演示如何使用CDML在图表标题,扇区标签和绘制徽标中包含多种字体和颜色。它还演示了银色背景颜色,圆角和标题的玻璃阴影效果。
-
银背景通过使用实现Chart.silverColor创建银色,然后用它在PieChart.PieChart作为图表背景颜色。
-
使用BaseChart.setRoundedFrame配置圆角框架。
-
包含多种字体和颜色的标题以CDML编写,并使用BaseChart.addTitle添加到图表中。
-
标题的玻璃着色效果使用Chart.glassEffect定义,然后使用标题TextBox对象的Box.setBackground应用于标题。
-
使用CDML设计的徽标使用BaseChart.addTitle2与BottomRight对齐添加到图表中作为另一个标题。
-
扇区标签的图标文件名使用BaseChart.addExtraField作为额外字段添加到图表中。
-
扇区标签格式字符串使用CDML和参数替换和格式指定为:
<* block,valign = absmiddle *> <* img = {field0} *> {label}({percent | 0}%)
这意味着扇区标签是一个块,其中包含一个图像,后跟扇区名称和百分比。图像文件取自额外字段。
-
格式字符串使用PieChart.setLabelFormat应用于图表。
-
对于Web应用程序,我们需要设置搜索路径以使用BaseChart.setSearchPath从当前脚本目录加载图标图像。这是因为对于某些Web服务器(例如IIS),默认的当前目录不是脚本目录(例如,IIS使用IIS可执行目录),因此需要显式设置搜索路径。
源代码清单
#include "chartdir.h"int main(int argc, char *argv[]){ // The data for the pie chart double data[] = {28, 45, 5, 1, 12}; // The labels for the pie chart const char *labels[] = {"Excellent", "Good", "Bad", "Very Bad", "Neutral"}; // The icons for the sectors const char *icons[] = {"laugh.png", "smile.png", "sad.png", "angry.png", "nocomment.png"}; // Create a PieChart object of size 560 x 300 pixels, with a silver background, black border, 1 // pxiel 3D border effect and rounded corners PieChart *c = new PieChart(560, 300, Chart::silverColor(), 0x000000, 1); c->setRoundedFrame(); // Set the center of the pie at (280, 150) and the radius to 120 pixels c->setPieSize(280, 150, 120); // Add a title box with title written in CDML, on a sky blue (A0C8FF) background with glass // effect c->addTitle( "<*block,valign=absmiddle*><*img=doc.png*> Customer Survey: " "<*font=timesi.ttf,color=000000*>Do you like our <*font,color=dd0000*>Hyper<*super*>TM" "<*/font*> molecules, "timesbi.ttf", 15, 0x000080)->setBackground(0xa0c8ff, 0x000000, Chart::glassEffect()); // Add a logo to the chart written in CDML as the bottom title aligned to the bottom right c->addTitle(Chart::BottomRight, "<*block,valign=absmiddle*><*img=molecule.png*> <*block*><*color=FF*>" "<*font=timesbi.ttf,size=12*>Molecular Engineeringn<*font=arial.ttf,size=10*>Creating " "better molecules"); // Set the pie data and the pie labels c->setData(DoubleArray(data, (int)(sizeof(data) / sizeof(data[0]))), StringArray(labels, (int)( sizeof(labels) / sizeof(labels[0])))); // Set 3D style c->set3D(); // Use the side label layout method c->setLabelLayout(Chart::SideLayout); // Set the label background color to transparent c->setLabelStyle()->setBackground(Chart::Transparent); // Add icons to the chart as a custom field c->addExtraField(StringArray(icons, (int)(sizeof(icons) / sizeof(icons[0])))); // Configure the sector labels using CDML to include the icon images c->setLabelFormat("<*block,valign=absmiddle*><*img={field0}*> {label} ({percent|0}%)"); // Explode the 3rd and 4th sectors as a group (index = 2 and 3) c->setExplodeGroup(2, 3); // Set the start angle to 135 degrees may improve layout when there are many small sectors at // the end of the data array (that is, data sorted in descending order). It is because this // makes the small sectors position near the horizontal axis, where the text label has the least // tendency to overlap. For data sorted in ascending order, a start angle of 45 degrees can be // used instead. c->setStartAngle(135); // Output the chart c->makeChart("iconpie2.png"); //free up resources delete c; return 0;}
关于ChartDirector的教程将会持续更新,敬请关注~
标签:图表
声明:本站部分文章及图片源自用户投稿,如本站任何资料有侵权请您尽早请联系jinwei@zod.com.cn进行处理,非常感谢!