Web图表控件ChartDirector连载教程分享之条形图描影,内附下载和链接。
ChartDirector是一个非常理想的图表工具,它拥有广泛的图表类型、分层架构、实时互动的大数据表、普遍适应于各种应用程序以及支持PDF和SVG图标等的优点。此系列连载旨在介绍ChartDirector的实用教程,供大家学习讨论。
渐变描影效果
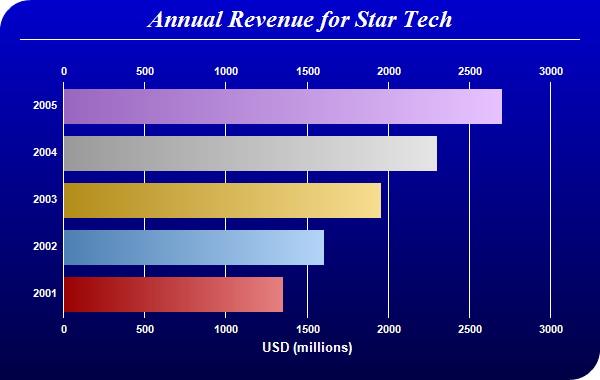

此示例演示如何使用条形渐变效果着色水平条形图,以及使用渐变颜色背景、部分圆形框架和绘图区域的大小自动调整来适应图表。
- 通过使用BaseChart.linearGradientColor定义渐变颜色来实现渐变背景,然后使用BaseChart.setBackground将其设置为图表背景颜色。
- 使用BaseChart.setRoundedFrame配置部分圆角框架。请注意,4个角中只有2个是圆角的。
- 使用XYChart.swapXY交换x轴和y轴,所以条形变为水平模式。
- 条形渐变效果使用Chart :: barLighting定义,然后使用Layer.setBorderColor应用于条形。
- 配置完整个图表后,XYChart.packPlotArea方法用于调整绘图区域大小,以便适应绘图区域和边界框。
源代码清单
以下代码可在“cppdemo / gradientbar ”中找到。MFC版本的代码可在“mfcdemo”中找到(仅限Windows版本)。QT版本的代码可在“qtdemo”中找到。
#include "chartdir.h"int main(int argc, char *argv[]){ // The data for the bar chart double data[] = {1350, 1600, 1950, 2300, 2700}; // The labels for the bar chart const char *labels[] = {"2001", "2002", "2003", "2004", "2005"}; // The colors for the bars int colors[] = {0xcc0000, 0x66aaee, 0xeebb22, 0xcccccc, 0xcc88ff}; // Create a PieChart object of size 600 x 380 pixels. XYChart *c = new XYChart(600, 380); // Use the white on black palette, which means the default text and line colors are white c->setColors(Chart::whiteOnBlackPalette); // Use a vertical gradient color from blue (0000cc) to deep blue (000044) as background. Use // rounded corners of 30 pixels radius for the top-left and bottom-right corners. c->setBackground(c->linearGradientColor(0, 0, 0, c->getHeight(), 0x0000cc, 0x000044)); c->setRoundedFrame(0xffffff, 30, 0, 30, 0); // Add a title using 18pt Times New Roman Bold Italic font. Add 6 pixels top and bottom margins // to the title. TextBox *title = c->addTitle("Annual Revenue for Star Tech", "timesbi.ttf", 18); title->setMargin(0, 0, 6, 6); // Add a separator line in white color just under the title c->addLine(20, title->getHeight(), c->getWidth() - 21, title->getHeight(), 0xffffff); // Tentatively set the plotarea at (70, 80) and of 480 x 240 pixels in size. Use transparent // border and white grid lines c->setPlotArea(70, 80, 480, 240, -1, -1, Chart::Transparent, 0xffffff); // Swap the axis so that the bars are drawn horizontally c->swapXY(); // Add a multi-color bar chart layer using the supplied data. Use bar gradient lighting with the // light intensity from 0.75 to 2.0 c->addBarLayer(DoubleArray(data, (int)(sizeof(data) / sizeof(data[0]))), IntArray(colors, (int)( sizeof(colors) / sizeof(colors[0]))))->setBorderColor(Chart::Transparent, Chart::barLighting(0.75, 2.0)); // Set the labels on the x axis. c->xAxis()->setLabels(StringArray(labels, (int)(sizeof(labels) / sizeof(labels[0])))); // Show the same scale on the left and right y-axes c->syncYAxis(); // Set the bottom y-axis title using 10pt Arial Bold font c->yAxis()->setTitle("USD (millions)", "arialbd.ttf", 10); // Set y-axes to transparent c->yAxis()->setColors(Chart::Transparent); c->yAxis2()->setColors(Chart::Transparent); // Disable ticks on the x-axis by setting the tick color to transparent c->xAxis()->setTickColor(Chart::Transparent); // Set the label styles of all axes to 8pt Arial Bold font c->xAxis()->setLabelStyle("arialbd.ttf", 8); c->yAxis()->setLabelStyle("arialbd.ttf", 8); c->yAxis2()->setLabelStyle("arialbd.ttf", 8); // Adjust the plot area size, such that the bounding box (inclusive of axes) is 30 pixels from // the left edge, 25 pixels below the title, 50 pixels from the right edge, and 25 pixels from // the bottom edge. c->packPlotArea(30, title->getHeight() + 25, c->getWidth() - 50, c->getHeight() - 25); // Output the chart c->makeChart("gradientbar.png"); //free up resources delete c; return 0;}
圆柱型描影

此示例演示了对条形图使用柱面着色效果。以及展示了绘图区域两侧的拉丝金属背景、圆形框架和轴标签。
- 通过使用Chart :: brushedSilverColor创建拉丝银色,然后在XYChart.XYChart中使用它作为图表背景颜色来实现拉丝银色背景。
- 使用BaseChart.setRoundedFrame配置圆角框架。
- 通过BarLayer.setBarShape与CircleShape配置圆柱遮光效果。
- XYChart.syncYAxis用于在绘图区域的两侧显示两个同步的y轴。
- Axis.setColors用于将y轴设置为“Transparent“,因此只有轴标签可见。
- 使用Axis.setLabelStyle将轴标签字体设置为Arial Bold 。
源代码清单
以下代码可在“cppdemo / cylinderlightbar ”中找到。MFC版本的代码可在“mfcdemo”中找到(仅限Windows版本)。QT版本的代码可在“qtdemo”中找到。
#include "chartdir.h"int main(int argc, char *argv[]){ // The data for the bar chart double data[] = {450, 560, 630, 800, 1100, 1350, 1600, 1950, 2300, 2700}; // The labels for the bar chart const char *labels[] = {"1996", "1997", "1998", "1999", "2000", "2001", "2002", "2003", "2004", "2005"}; // Create a XYChart object of size 600 x 380 pixels. Set background color to brushed silver, // with a 2 pixel 3D border. Use rounded corners of 20 pixels radius. XYChart *c = new XYChart(600, 380, Chart::brushedSilverColor(), Chart::Transparent, 2); // Add a title to the chart using 18pt Times Bold Italic font. Set top/bottom margins to 8 // pixels. c->addTitle("Annual Revenue for Star Tech", "timesbi.ttf", 18)->setMargin(0, 0, 8, 8); // Set the plotarea at (70, 55) and of size 460 x 280 pixels. Use transparent border and black // grid lines. Use rounded frame with radius of 20 pixels. c->setPlotArea(70, 55, 460, 280, -1, -1, Chart::Transparent, 0x000000); c->setRoundedFrame(0xffffff, 20); // Add a multi-color bar chart layer using the supplied data. Set cylinder bar shape. c->addBarLayer(DoubleArray(data, (int)(sizeof(data) / sizeof(data[0]))), IntArray(0, 0) )->setBarShape(Chart::CircleShape); // Set the labels on the x axis. c->xAxis()->setLabels(StringArray(labels, (int)(sizeof(labels) / sizeof(labels[0])))); // Show the same scale on the left and right y-axes c->syncYAxis(); // Set the left y-axis and right y-axis title using 10pt Arial Bold font c->yAxis()->setTitle("USD (millions)", "arialbd.ttf", 10); c->yAxis2()->setTitle("USD (millions)", "arialbd.ttf", 10); // Set y-axes to transparent c->yAxis()->setColors(Chart::Transparent); c->yAxis2()->setColors(Chart::Transparent); // Disable ticks on the x-axis by setting the tick color to transparent c->xAxis()->setTickColor(Chart::Transparent); // Set the label styles of all axes to 8pt Arial Bold font c->xAxis()->setLabelStyle("arialbd.ttf", 8); c->yAxis()->setLabelStyle("arialbd.ttf", 8); c->yAxis2()->setLabelStyle("arialbd.ttf", 8); // Output the chart c->makeChart("cylinderlightbar.jpg"); //free up resources delete c; return 0;}
想要购买ChartDirector正版授权,或者获取更多该产品相关信息的朋友可以点击” 咨询在线客服 “~
海量产品正在参加年终大促,价格优惠!详情请点击” 年终巅峰钜惠 “~
标签:Web图表交互图表
声明:本站部分文章及图片源自用户投稿,如本站任何资料有侵权请您尽早请联系jinwei@zod.com.cn进行处理,非常感谢!