本次TeeChart Pro .NET使用教程将为大家带来如何处理高级轴和图例操作。
TeeChart Pro 将自动为您定义所有 Axis 标签,并提供足够的灵活性来定制您可能有的任何特定要求。 TeeChart Pro 提供真正的多轴。 这些在设计或运行时可用,并为 Axis 定义提供了无数的可能性和灵活性。
点击立即下载最新版TeeChart for .NET
轴控制-关键区域
- Scales
将系列数据添加到图表时会自动设置轴刻度。 您可以在设计时或运行时使用 Axis 属性更改默认值。


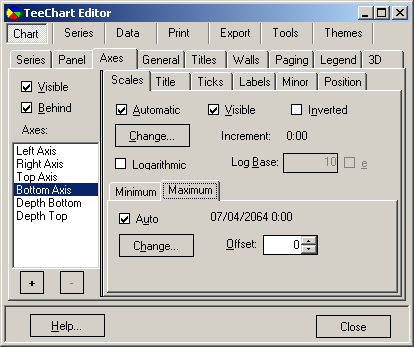
自动选择最佳轴刻度范围以适合您的数据。 如果您关闭“自动”,比例部分将变为灰色选项,您可以更改轴值。 重要的是,请记住从页面左侧的轴列表中选择要配置的轴。
[C#.Net]Random rnd = new Random();for(int i = 0; i <= 40; ++i) line1.Add(Convert.ToDouble(i),rnd.Next(100),Color.Red); [VB.Net] Dim i As Integer For i = 0 To 40 Line1.Add(Convert.ToDouble(i), Rnd() * 100, Color.Red) Next i
您可以使用以下代码在运行时更改最大值和最小值:
[C#.Net]Steema.TeeChart.Axis bottomAxis = tChart1.Axes.Bottom;bottomAxis.Automatic = false;bottomAxis.Maximum = 36;bottomAxis.Minimum = 5;[VB.Net]With TChart1.Axes.Bottom .Automatic = False .Maximum = 36 .Minimum = 5End With
您可以将轴刻度最大值和最小值分别设置为自动。 例如:
[C#.Net]Steema.TeeChart.Axis bottomAxis = tChart1.Axes.Bottom;bottomAxis.AutomaticMaximum = true;bottomAxis.AutomaticMinimum = false;bottomAxis.Minimum = 5;[VB.Net]With TChart1.Axes.Bottom .AutomaticMaximum = True .AutomaticMinimum = False .Minimum = 5End With
您可以定制轴的间隔。 从 Axis 页面的 Scales 部分选择 Desired Increment 组合框并添加您需要的增量。 您可以在运行时通过代码更改它:
[C#.Net]Steema.TeeChart.Axis bottomAxis = tChart1.Axes.Bottom;bottomAxis.Increment = 20;[VB.Net]With TChart1.Axes.Bottom .Increment = 20End With
如果您的数据是日期时间(您可以通过转到系列,常规页面将数据设置为您的系列的日期时间),图表->轴页面,比例部分将显示日期时间范围。 从 Desired Increment 组合框中显示的范围中选择增量并添加一些示例数据:
[C#.Net]Random rnd = new Random();DateTime today = DateTime.Today;TimeSpan oneDay = TimeSpan.FromDays(1);line1.XValues.DateTime = true;for(int i = 1; i <= 25; ++i) line1.Add(today,rnd.Next(100),Color.Red); today += oneDay; [VB.Net] Dim i As Integer Dim Today As DateTime = DateTime.Today Dim OneDay As TimeSpan = TimeSpan.FromDays(1) Line1.XValues.DateTime = True For i = 1 To 25 Line1.Add(Today, Rnd() * 100, Color.Red) Today = Today.Add(OneDay) Next
在运行时更改增量:
[C#.Net]Steema.TeeChart.Axis bottomAxis = tChart1.Axes.Bottom;bottomAxis.Increment = Steema.TeeChart.Utils.GetDateTimeStep(Steema.TeeChart.DateTimeSteps.TwoDays);[VB.Net]With TChart1.Axes.Bottom .Increment = Steema.TeeChart.Utils.GetDateTimeStep(Steema.TeeChart.DateTimeSteps.TwoDays)End With
更改轴标签频率时,请记住 TeeChart 将根据 AxisLabels.Separation 属性的设置避免标签重叠。 这意味着如果标签频率太高而无法适应标签,则 TeeChart 将分配“最佳匹配”。 更改标签角度和标签分隔是 2 个选项,可以帮助您适应所需的标签。
标题在 Axis 页面的 Titles 部分中设置。 您可以更改轴的标题文本及其字体和阴影属性。 也可以指定标题文本的角度和大小。
您可以将所有标准数字和日期格式应用于轴标签。 轴页面,标签部分包含“值格式”字段。 如果您的数据是日期时间,则字段名称将更改为“日期时间格式”。 在运行时使用:
[C#.Net]tChart1.Axes.Bottom.Labels.ValueFormat = "#,##0.00;(#,##0.00)";[VB.Net]With TChart1.Axes.Bottom .Labels.ValueFormat = "#,##0.00;(#,##0.00)"End With
或日期时间数据
[C#.Net]tChart1.Axes.Bottom.Labels.DateTimeFormat = "dddd/MMMM/yyyy";[VB.Net]With TChart1.Axes.Bottom .Labels.DateTimeFormat = "dddd/MMMM/yyyy"End With MultiLine labels
轴标签可以显示为多行文本,而不是单行文本。 使用 LineSeparator 字符 () 分隔行。例如:
[C#.Net]bar1.Add(1234, "New" + Steema.TeeChart.Texts.LineSeparator + "Cars", Color.Red);bar1.Add(2000, "Old" + Steema.TeeChart.Texts.LineSeparator + "Bicycles", Color.Red);tChart1.Panel.MarginBottom = 10;[VB.Net]Bar1.Add(1234, "New" + Steema.TeeChart.Texts.LineSeparator + "Cars", Color.Red)Bar1.Add(2000, "Old" + Steema.TeeChart.Texts.LineSeparator + "Bicycles", Color.Red)TChart1.Panel.MarginBottom = 10
DateTime 标签的示例:下面将在两行文本中显示底部轴标签,一行显示月份和日期,第二行显示年份:
2 月 28 日 Mar-1 ..
2003 2003 ..
[C#.Net]bar1.Add(DateTime.Parse("28/2/2003"), 100, Color.Red);bar1.Add(DateTime.Parse("1/3/2003"), 200, Color.Red);bar1.Add(DateTime.Parse("2/3/2003"), 150, Color.Red);bar1.XValues.DateTime = true;tChart1.Axes.Bottom.Labels.DateTimeFormat = "MM/dd hh:mm";tChart1.Axes.Bottom.Labels.MultiLine = true;tChart1.Panel.MarginBottom = 10;[VB.Net]Bar1.Add(DateValue("28/2/2003"), 100, Color.Red)Bar1.Add(DateValue("1/3/2003"), 200, Color.Red)Bar1.Add(DateValue("2/3/2003"), 150, Color.Red)Bar1.XValues.DateTime = TrueTChart1.Axes.Bottom.Labels.DateTimeFormat = "MM/dd hh:mm"TChart1.Axes.Bottom.Labels.MultiLine = TrueTChart1.Panel.MarginBottom = 10
将 AxisLabels.MultiLine 属性设置为 True 将自动将标签拆分为有空格的行,从而有效地将标签分为两部分:’mm/dd’ 代表第一行;’hh:mm’ 第二行。
在运行时,您始终可以使用 OnGetAxisLabel 事件以编程方式将标签拆分为行:
[C#.Net]private void tChart1_GetAxisLabel(object sender, Steema.TeeChart.TChart.GetAxisLabelEventArgs e) string myLabelText = e.LabelText; tChart1.Axes.Bottom.Labels.SplitInLines(ref myLabelText, " "); e.LabelText = myLabelText; [VB.Net]Private Sub TChart1_GetAxisLabel(ByVal sender As Object, ByVal e As Steema.TeeChart.TChart.GetAxisLabelEventArgs) Handles TChart1.GetAxisLabel Dim myLabelText As String myLabelText = e.LabelText TChart1.Axes.Bottom.Labels.SplitInLines(myLabelText, " ") e.LabelText = myLabelTextEnd Sub
在上面的示例中,全局“TeeSplitInLines”过程将“LabelText”中的所有空格转换为行分隔符(返回)。
轴 AxisLabels.Angle 属性也可以与多线轴标签一起使用。
进一步的标签控制可以通过使用 Axis 事件来获得。 这些事件允许您激活/停用/更改任何单个轴标签。 以下示例修改每个标签,在点索引值前面放置一个文本短语:
[C#.Net]private void button1_Click(object sender, System.EventArgs e) bar1.FillSampleValues(20); tChart1.Axes.Bottom.Labels.Style = AxisLabelStyle.Mark; private void tChart1_GetAxisLabel(object sender, Steema.TeeChart.TChart.GetAxisLabelEventArgs e) if(((Steema.TeeChart.Axis)sender).Equals(tChart1.Axes.Bottom)) e.LabelText = "Period " + Convert.ToString(e.ValueIndex); [VB.Net]Private Sub Button1_Click(ByVal sender As Object, ByVal e As System.EventArgs) Handles Button1.Click Bar1.FillSampleValues(20) TChart1.Axes.Bottom.Labels.Style = Steema.TeeChart.AxisLabelStyle.MarkEnd SubPrivate Sub TChart1_GetAxisLabel(ByVal sender As Object, ByVal e As Steema.TeeChart.TChart.GetAxisLabelEventArgs) Handles TChart1.GetAxisLabel If CType(sender, Steema.TeeChart.Axis) Is TChart1.Axes.Bottom Then e.LabelText = "Period " & e.ValueIndex End IfEnd Sub
正态对数标记可以通过以下方式设置:
[C#.Net]private void button1_Click(object sender, System.EventArgs e) Random rnd = new Random(); Steema.TeeChart.Axis leftAxis = tChart1.Axes.Left; tChart1.Aspect.View3D = false; bar1.Marks.Visible = false; for(int i = 0; i <= 100; ++i) bar1.Add(rnd.Next(100) * i); leftAxis.LogarithmicBase = 10; leftAxis.Logarithmic = true; leftAxis.SetMinMax(0, 10000); leftAxis.Labels.ValueFormat = "#e+0"; //exponential format [VB.Net] Private Sub Button1_Click(ByVal sender As Object, ByVal e As System.EventArgs) Handles Button1.Click Dim i As Integer TChart1.Aspect.View3D = False Bar1.Marks.Visible = False For i = 0 To 10000 Step 100 Bar1.Add(Rnd() * i) Next With TChart1.Axes.Left .LogarithmicBase = 10 .Logarithmic = True .SetMinMax(0, 10000) .Labels.ValueFormat = "#e+0" ' exponential format End With End Sub
标签将根据对数基数(默认为 10)设置,因此在这种情况下,标签为 1、10、100、1000、10000。
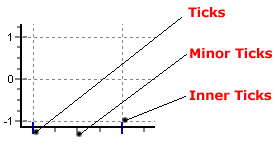
有 3 种刻度类型和 2 种 格类型。 您可以更改每个刻度和 格类型的长度、宽度和颜色。 可以通过“Ticks”选项卡对 Ticks、它们关联的 Grid 和 Inner Ticks 进行更改; 可以通过“次要”选项卡对次要刻度及其相关 格进行更改。 TeeChart Pro 版本 5 的新增功能是能够更改宽度大于 1(默认)的刻度和 格的样式。
[C#.Net]Steema.TeeChart.Axis bottomAxis = tChart1.Axes.Bottom;bottomAxis.Ticks.Length = 7;bottomAxis.Ticks.Color = Color.Green;bottomAxis.MinorTickCount = 10;[VB.Net]With TChart1.Axes.Bottom .Ticks.Length = 7 .Ticks.Color = Color.Green .MinorTickCount = 10End With
轴具有修改每个轴的位置的属性。 在此示例中,轴移动了图表总宽度的 50%,因此它显示在图表中心:
[C#.Net]Steema.TeeChart.Axis bottomAxis = tChart1.Axes.Bottom;bottomAxis.PositionUnits = PositionUnits.Percent;bottomAxis. RelativePosition = 50[VB.Net]With TChart1.Axes.Bottom .PositionUnits = PositionUnits.Percent .RelativePosition = 50End With
如果您想了解TeeChart for .NET正版价格,欢迎咨询在线客服
标签:
声明:本站部分文章及图片源自用户投稿,如本站任何资料有侵权请您尽早请联系jinwei@zod.com.cn进行处理,非常感谢!