本次TeeChart Pro .NET使用教程将为大家带来如何处理高级轴和图例操作。
点击立即下载最新版TeeChart for .NET
附加轴
- 复制轴
TeeChart 提供 5 个与数据系列相关联的轴:左、上、下、右和深度。 当您将新系列添加到图表时,您可以定义系列应该与哪个轴相关(转到系列选项卡,常规页面)。 您可以使用 Axis Customdraw 方法在图表上的任何位置重复前面 4 个轴中的任何一个(或全部)。 请注意,此方法会复制您的轴,它不会添加新的自定义轴。例子:
[C#.Net]private void Form1_Load(object sender, System.EventArgs e) Random Rnd = new Random(); tChart1.Aspect.View3D = false; tChart1.Panel.Gradient.Visible = true; for(int t = 0; t <= 20; ++t) line1.Add(t, ((Rnd.Next(100)) + 1) - ((Rnd.Next(70)) + 1), Color.Red); private void line1_BeforeDrawValues(object sender, Steema.TeeChart.Drawing.Graphics3D g) int posAxis = 0; if(tChart1.Axes.Left.Maximum > 0) tChart1.Axes.Left.Draw(g.ChartXCenter - 10,g.ChartXCenter - 20,g.ChartXCenter,true); posAxis = tChart1.Axes.Left.CalcYPosValue(10); tChart1.Axes.Bottom.Draw(posAxis + 10, posAxis + 40, posAxis, true); [VB.Net]Private Sub Form1_Load(ByVal sender As System.Object, ByVal e As System.EventArgs) Handles MyBase.Load Dim t As Integer TChart1.Aspect.View3D = False TChart1.Panel.Gradient.Visible = True For t = 0 To 20 Line1.Add(t, ((Rnd() * 100) + 1) - ((Rnd() * 70) + 1), Color.Red) Next End SubPrivate Sub Line1_BeforeDrawValues(ByVal sender As Object, ByVal g As Steema.TeeChart.Drawing.Graphics3D) Handles Line1.BeforeDrawValues Dim posAxis As Integer If TChart1.Axes.Left.Maximum > 0 Then TChart1.Axes.Left.Draw(g.ChartXCenter - 10, g.ChartXCenter - 20, g.ChartXCenter, True) posAxis = TChart1.Axes.Left.CalcYPosValue(10) TChart1.Axes.Bottom.Draw(posAxis + 10, posAxis + 40, posAxis, True) End IfEnd Sub
上面的示例代码将生成下图:
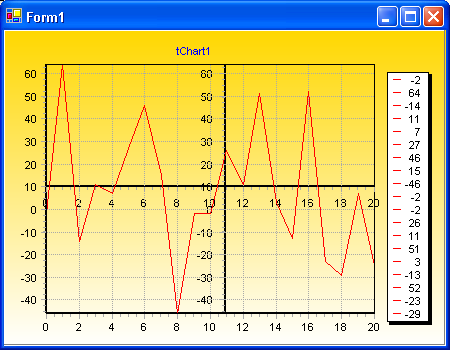

在此示例中,TeeChart 将在图表中心绘制新轴,一个水平轴和一个垂直轴。 当您滚动图表(用鼠标右键拖动)时,新的垂直轴将始终保持在图表的中心,新的水平轴将随着垂直滚动上下移动。 新轴是默认轴的精确副本。
Via Code[C#.Net]private void Form1_Load(object sender, System.EventArgs e) Line line1 = new Line(); Line line2 = new Line(); tChart1.Aspect.View3D = false; tChart1.Panel.Gradient.Visible = true; tChart1.Header.Text = "TeeChart Multiple Axes"; tChart1.Series.Add(line1); tChart1.Series.Add(line2); for(int t = 0; t <= 10; ++t) line1.Add(Convert.ToDouble(t), Convert.ToDouble(10 + t), Color.Red); if(t > 1) line2.Add(Convert.ToDouble(t), Convert.ToDouble(t), Color.Green); Axis leftAxis = tChart1.Axes.Left; leftAxis.StartPosition = 0; leftAxis.EndPosition = 50; leftAxis.AxisPen.Color = Color.Red; leftAxis.Title.Font.Color = Color.Red; leftAxis.Title.Font.Bold = true; leftAxis.Title.Text = "1st Left Axis";// You are able to then position the new Axis in overall relation to the Chart // by using the StartPosition and EndPosition properties.//// StartPosition=50// EndPosition=100//// These figures are expressed as percentages of the Chart Rectangle with 0 (zero)// (in the case of a vertical Axis) being Top. These properties can be applied to // the Standard Axes to create completely partitioned 'SubCharts' within the Chart. Axis axis1 = new Axis(false, false, tChart1.Chart); tChart1.Axes.Custom.Add(axis1); line2.CustomVertAxis = axis1; axis1.StartPosition = 50; axis1.EndPosition = 100; axis1.AxisPen.Color = Color.Green; axis1.Title.Font.Color = Color.Green; axis1.Title.Font.Bold = true; axis1.Title.Text = "Extra Axis"; axis1.PositionUnits= PositionUnits.Percent; axis1.RelativePosition = 20; [VB.Net]Private Sub Form1_Load(ByVal sender As System.Object, ByVal e As System.EventArgs) Handles MyBase.Load Dim Line1 As New Steema.TeeChart.Styles.Line() Dim Line2 As New Steema.TeeChart.Styles.Line() Dim t As Integer TChart1.Aspect.View3D = False TChart1.Panel.Gradient.Visible = True TChart1.Header.Text = "TeeChart Multiple Axes" TChart1.Series.Add(Line1) TChart1.Series.Add(Line2) For t = 0 To 10 Line1.Add(t, 10 + t, Color.Red) If (t > 1) Then Line2.Add(t, t, Color.Green) End If Next With TChart1.Axes.Left .StartPosition = 0 .EndPosition = 50 .AxisPen.Color = Color.Red .Title.Font.Color = Color.Red .Title.Font.Bold = True .Title.Text = "1st Left Axis" End With 'You are able to then position the new Axis in overall relation to the Chart 'by using the StartPosition and EndPosition properties. ' StartPosition = 50 ' EndPosition = 100 'These figures are expressed as percentages of the Chart Rectangle with 0 (zero) '(in the case of a vertical Axis) being Top. These properties can be applied to 'the Standard Axes to create completely partitioned 'SubCharts' within the Chart. Dim Axis1 As New Steema.TeeChart.Axis(False, False, TChart1.Chart) TChart1.Axes.Custom.Add(Axis1) Line2.CustomVertAxis = Axis1 Axis1.StartPosition = 50 Axis1.EndPosition = 100 Axis1.AxisPen.Color = Color.Green Axis1.Title.Font.Color = Color.Green Axis1.Title.Font.Bold = True Axis1.Title.Text = "Extra Axis" Axis1.PositionUnits.= PositionUnits.Percent; Axis1.RelativePosition = 20End Sub
上面的编码示例将显示以下图表:
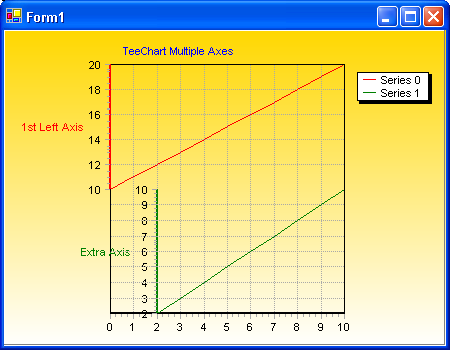
选择是无限的! 我们建议在使用自定义轴时要小心,因为很容易开始用新轴填充屏幕并忘记要管理哪个轴!
轴事件提供运行时灵活性来修改轴标签并在轴点击上呈现用户交互性。
接下来举一个 OnClickAxis 事件的例子。
[C#.Net]private void tChart1_ClickAxis(object sender, System.Windows.Forms.MouseEventArgs e) if(((Steema.TeeChart.Axis)sender).Equals(tChart1.Axes.Bottom)) MessageBox.Show("Clicked Bottom Axis at: " + line1.XScreenToValue(e.X)); [VB.Net]Private Sub TChart1_ClickAxis(ByVal sender As Object, ByVal e As System.Windows.Forms.MouseEventArgs) Handles TChart1.ClickAxis If CType(sender, Steema.TeeChart.Axis) Is TChart1.Axes.Bottom Then MsgBox("Clicked Bottom Axis at: " & Line1.XScreenToValue(e.X)) End IfEnd Sub
可用于修改轴标签。接下来来看一个OnGetAxisLabel 事件的例子。
[C#.Net]private void button1_Click(object sender, System.EventArgs e) bar1.FillSampleValues(20); tChart1.Axes.Bottom.Labels.Style = AxisLabelStyle.Mark; private void tChart1_GetAxisLabel(object sender, Steema.TeeChart.TChart.GetAxisLabelEventArgs e) if(((Steema.TeeChart.Axis)sender).Equals(tChart1.Axes.Bottom)) e.LabelText = "Period " + Convert.ToString(e.ValueIndex); [VB.Net]Private Sub Button1_Click(ByVal sender As Object, ByVal e As System.EventArgs) Handles Button1.Click Bar1.FillSampleValues(20) TChart1.Axes.Bottom.Labels.Style = Steema.TeeChart.AxisLabelStyle.MarkEnd SubPrivate Sub TChart1_GetAxisLabel(ByVal sender As Object, ByVal e As Steema.TeeChart.TChart.GetAxisLabelEventArgs) Handles TChart1.GetAxisLabel If CType(sender, Steema.TeeChart.Axis) Is TChart1.Axes.Bottom Then e.LabelText = "Period " & e.ValueIndex End IfEnd Sub
可用于决定应显示哪些轴标签。下面是一个OnGetNextAxisLabel事件例子,您应该使用 e.Stop Boolean属性来包含/排除轴标签。
[C#.Net]private void Form1_Load(object sender, System.EventArgs e) line1.FillSampleValues(20); private void tChart1_GetNextAxisLabel(object sender, Steema.TeeChart.TChart.GetNextAxisLabelEventArgs e) if(((Steema.TeeChart.Axis)sender).Equals(tChart1.Axes.Bottom)) e.Stop = false; switch(e.LabelIndex) case 0: e.LabelValue = 5; break; case 1: e.LabelValue = 13; break; case 2: e.LabelValue = 19; break; default: e.Stop = true; break; [VB.Net]Private Sub Form1_Load(ByVal sender As System.Object, ByVal e As System.EventArgs) Handles MyBase.Load Line1.FillSampleValues(20)End SubPrivate Sub TChart1_GetNextAxisLabel(ByVal sender As Object, ByVal e As Steema.TeeChart.TChart.GetNextAxisLabelEventArgs) Handles TChart1.GetNextAxisLabel If CType(sender, Steema.TeeChart.Axis) Is TChart1.Axes.Bottom Then e.Stop = False Select Case e.LabelIndex Case 0 : e.LabelValue = 5 Case 1 : e.LabelValue = 13 Case 2 : e.LabelValue = 19 Case Else : e.Stop = True End Select End IfEnd Sub
如果您想了解TeeChart for .NET正版价格,欢迎咨询在线客服
标签:
声明:本站部分文章及图片源自用户投稿,如本站任何资料有侵权请您尽早请联系jinwei@zod.com.cn进行处理,非常感谢!