首先让我们一起来了解一下背景。
什么是Kendo UI/strong>
Kendo UI是一个全面的Web用户界面框架,其中包含JavaScript UI组件的集合,这些JavaScript UI组件具有jQuery库以及Vue、React和Angular等更现代的库。 Kendo UI开发人员使用大量的UI小部件和数据可视化组件来构建交互式且响应迅速的高性能应用程序。
为什么选择Kendo UI/strong>
使用Kendo UI,您可以轻松地将真正高级的UI组件添加到您选择库的前端项目中,不必担心接口的关键功能,而且可以节省时间,只需关注专有功能即可。 Kendo UI附带了易于使用的集成,支持您喜欢的每个前端Web框架(例如Vue.js)。
除基本的UI组件外,Kendo UI还为您提供了高级的数据可视化UI元素,可确保您不必向项目中添加其他库即可处理图表,这些高级UI元素也可自定义。
你会构建什么/strong>

您将使用Kendo UI在Vue.js中构建气候视图UI组件,将首先使用VS Code中的Kendo UI starter扩展scaffolding,然后使用Vue Router创建路由,最后使用一些Kendo UI图表组件来构建界面。
入门指南
假设您已经安装了Vue; 如果没有,请转到安装指南。现在打开您的VS Code,要做的第一件事是安装Kendo UI模板向导扩展。您可以通过转到VS Code的扩展程序标签并搜索 “Kendo UI Template”来实现,继续下载,重新启动VS Code之后,现在可以使用它来搭建新项目了。
如何使用
- 打开VSCode
- 在Windows / Linux中按ctrl + shift + p,在Mac中按P打开VSCode的扩展程序启动器
- 输入/选择Kendo UI Template Wizard:启动并按Enter启动扩展
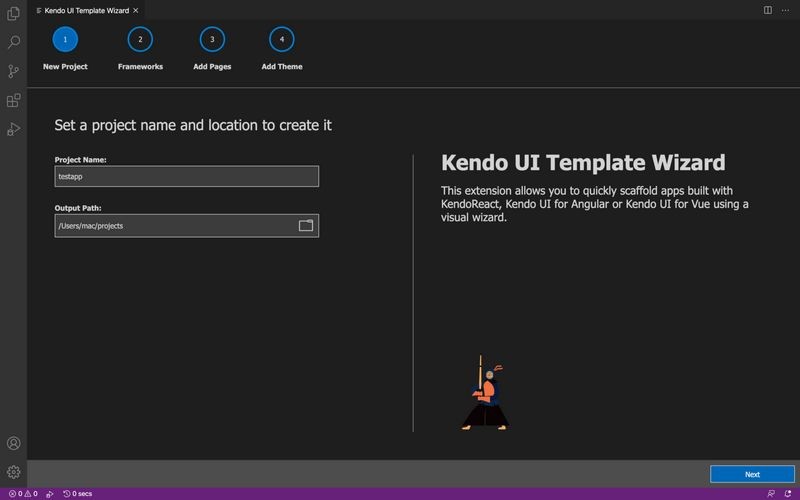
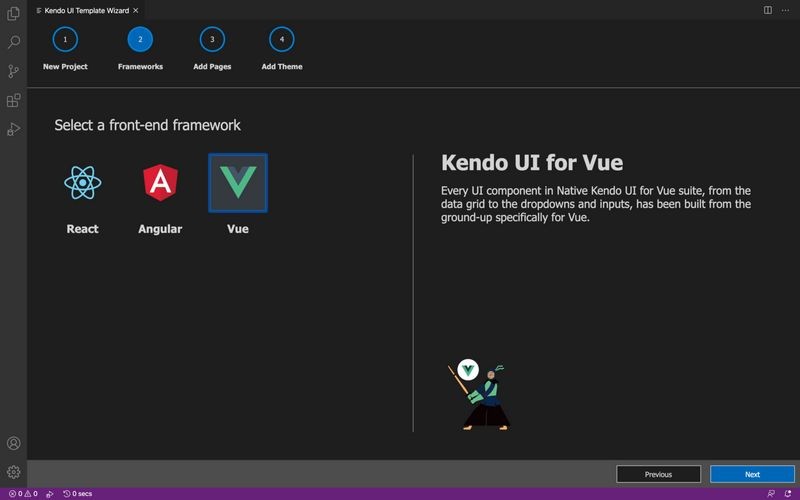
您可以先选择一个项目名称和一个文件夹来开始,单击Next时,系统会提示您选择要使用的前端库,Kendo UI具有Vue、Angular和React的组件元素。
下一步是选择新项目中所需的页面,对于此项目,您可以选择一个带有路由的图表。选择之后,模板向导将在后台运行Vue create命令,并为您搭建Vue应用程序。
配置
既然已经完成了应用程序的scaffolding工作,那么您必须通过运行以下命令来确保正确安装了所有依赖项:
cd newapp
npm install
导航到新应用程序的根目录,并在main.js文件中,确保它看起来是这样:
import Vue from 'vue'import App from './App.vue'import router from "./router";Vue.config.productionTip = falsenew Vue({render: h => h(App),router}).$mount('#app')
您可以看到路由已引入到项目中,如果您没有使用Kendo UI template wizard或选择了一个空白项目,则可以在项目终端中使用以下命令轻松添加路由:
vue add router
在app.vue文件中,将内容替换为以下代码块:
<template><div id="root"><div class="content"><router-view></router-view></div></div></template><script>export default {name: 'app',components: {}}</script>
现在已将导入的路由引入这里,如果打开路由文件夹,将看到已在其中注册路由的路由脚本(index.js)。 确保您的外观如下所示:
import Vue from "vue";import Router from "vue-router";import Home from "../components/Home";import Chart1 from "../components/Chart1";import Chart2 from "../components/Chart2";Vue.use(Router);export default new Router({mode: "history",routes: [{path: "/",name: "Home",component: Home},{path: "/Chart1",name: "Chart1",component: Chart1},{path: "/Chart2",name: "Chart2",component: Chart2}]});
现在,当您查看app.vue文件时,将看到这些定义的路由引入的位置。要定义这些单独的路由,请导航到components文件夹。您将看到很多组件,删除所有组件,仅保留主组件。
添加单个组件
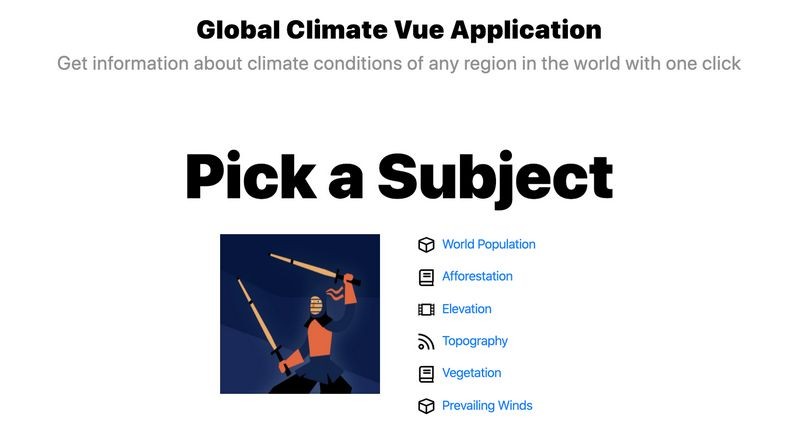
您的主组件home.vue应如以下代码块所示:
<template><div class="container mt-5"><div class='row'><div class='col-12'><h1 class='welcome mb-0'>Global Climate Vue Application</h1><h2 class='sub-header mt-0'>Get information about climate conditions of any region in the world with one click</h2></div></div><div class='row'><div class='col-12'><h1 class='get-started'>Pick a Subject</h1></div></div><div class='row justify-content-center'><div class='col-6 text-right'><div class='kendoka-div'><img class='kendoka' src="../assets/images/kendoka-vue.svg" alt='kendoka' /></div></div><div class='col-6 components-list'><p><img src="../assets/images/components.svg" alt='components' /><router-link to="/Chart1">World Population</router-link></p><p><img src="../assets/images/styles.svg" alt='styles' /><router-link to="/Chart1">Afforestation</router-link></p><p><img src="../assets/images/blogs.svg" alt='blogs' /><router-link to="/Chart1">Elevation</router-link></p><p><img src="../assets/images/tutorials.svg" alt='tutorials' /><router-link to="/Chart1">Topography</router-link></p><p><img src="../assets/images/styles.svg" alt='styles' /><router-link to="/Chart1">Vegetation</router-link></p><p><img src="../assets/images/components.svg" alt='components' /><router-link to="/Chart1">Prevailing Winds</router-link></p></div></div></div></template><script>export default {data: function() {return {publicPath: process.env.BASE_URL}}}</script>
添加路线图
您可能会遇到错误,可能会询问您在路由脚本中定义的路由。 要创建这些文件,请在components文件夹中创建一个chart1.vue文件,并在其中复制以下代码块:
<template><div class='container-fluid'><div class='row my-4 mt-5'><div class='col-12 col-lg-9 border-right' ><div v-if="loading" class="k-loading-mask"><span class="k-loading-text">Loading</span><div class="k-loading-image"></div><div class="k-loading-color"></div></div><Chart :title-text="'World Population'":title-font="'19pt sans-serif'":title-margin-bottom="50":legend-position="'bottom'":series="series":theme="'sass'"></Chart></div><div class='col-12 col-lg-3 mt-3 mt-lg-0'><h2>View by Continent</h2><ul><li><h3><router-link to="/Chart2">Asia</router-link></h3></li><li><h3><router-link to="/Chart2">Africa</router-link></h3></li><li><h3><router-link to="/Chart2">North America</router-link></h3></li><li><h3><router-link to="/Chart2">South America</router-link></h3></li><li><h3><router-link to="/Chart2">Australia</router-link></h3></li></ul></div></div></div></template><script>import '@progress/kendo-ui/js/kendo.dataviz.chart'import { Chart } from '@progress/kendo-charts-vue-wrapper';export default {mounted: function(){setTimeout(() => {this.loading = false;}, 300);},components: {Chart},data: function() {return {loading: true,series: [{type: "pie",labels: {visible: true,format: "p0"},connectors: {width: 0},data: [{ category: 'EUROPE', value: 0.09 },{ category: 'NORTH AMERICA', value: 0.06 },{ category: 'AUSTRALIA', value: 0.02 },{ category: 'ASIA', value: 0.60 },{ category: 'SOUTH AMERICA', value: 0.06 },{ category: 'AFRICA', value: 0.17 }]}]}}}</script>
在这里,我们使用Kendo UI图表组件,该组件带有一个特殊的动画,因为它可以根据大陆人口来定义大陆。 Kendo UI与Vue完美地集成在一起,您可以在特定组件的Vue返回函数中添加很多选项。
对于第二种方法,在components文件夹中创建一个Chart2.vue文件,然后在其中复制下面的代码块:
<template><div style="width: 600px" class="container-fluid col-12 col-lg-9 mt-5"><h2 style="text-align:center;margin:60px;">Climate Report for Africa</h2><div class="climate "><h3>Climate control history</h3><table class="history"><tr><td class="spark"><kendo-sparkline :data="pressLogData" :theme="'sass'"></kendo-sparkline></td><td class="value">980<span>mb</span></td></tr><tr><td class="spark"><kendo-sparkline :type="'column'":data="tempLogData":tooltip-format="'{0} %'":theme="'sass'"></kendo-sparkline></td><td class="value">21<span>°C</span></td></tr><tr><td class="spark"><kendo-sparkline :type="'area'":data="humLogData":tooltip-format="'{0} %'":theme="'sass'"></kendo-sparkline></td><td class="value">32<span>%</span></td></tr></table></div><div class="temperature"><h3>Temperature control</h3><div class="stats"><kendo-sparkline id="temp-range":type="'bullet'":data="tempRangeData":tooltip-visible="false":value-axis="tempRangeValueAxisOpt":theme="'sass'"></kendo-sparkline></div></div><div class="conditioner"><h3>Conditioner working time</h3><ul class="pie-list stats"><li>MON<kendo-sparkline id="stats-mon":type="'pie'":data="[14,10]":theme="'sass'"></kendo-sparkline></li><li>TUE<kendo-sparkline id="stats-tue":type="'pie'":data="[8,6]":theme="'sass'"></kendo-sparkline></li><li>WED<kendo-sparkline id="stats-wed":type="'pie'":data="[8,16]":theme="'sass'"></kendo-sparkline></li><li>THU<kendo-sparkline id="stats-thu":type="'pie'":data="[12,12]":theme="'sass'"></kendo-sparkline></li><li>FRI<kendo-sparkline id="stats-fri":type="'pie'":data="[6,18]":theme="'sass'"></kendo-sparkline></li><li>SAT<kendo-sparkline id="stats-sat":type="'pie'":data="[1,23]":theme="'sass'"></kendo-sparkline></li><li>SUN<kendo-sparkline id="stats-sun":type="'pie'":data="[5,19]":theme="'sass'"></kendo-sparkline></li></ul></div></div></template><script>import Vue from 'vue'import '@progress/kendo-ui';import { KendoSparkline } from '@progress/kendo-charts-vue-wrapper';Vue.component('kendo-sparkline', KendoSparkline);export default {components: {KendoSparkline},data: function() {return {pressLogData: [936, 968, 1025, 999, 998, 1014, 1017, 1010, 1010, 1007,1004, 988, 990, 988, 987, 995, 946, 954, 991, 984,974, 956, 986, 936, 955, 1021, 1013, 1005, 958, 953,952, 940, 937, 980, 966, 965, 928, 916, 910, 980],tempLogData: [16, 17, 18, 19, 20, 21, 21, 22, 23, 22,20, 18, 17, 17, 16, 16, 17, 18, 19, 20,21, 22, 23, 25, 24, 24, 22, 22, 23, 22,22, 21, 16, 15, 15, 16, 19, 20, 20, 21],humLogData: [71, 70, 69, 68, 65, 60, 55, 55, 50, 52,73, 72, 72, 71, 68, 63, 57, 58, 53, 55,63, 59, 61, 64, 58, 53, 48, 48, 45, 45,63, 64, 63, 67, 58, 56, 53, 59, 51, 54],tempRangeData: [21, 23],tempRangeValueAxisOpt: {min: 0,max: 30,plotBands: [{from: 0, to: 15, color: '#787878', opacity: 0.15}, {from: 15, to: 22, color: '#787878', opacity: 0.3}, {from: 22, to: 30, color: '#787878', opacity: 0.15}]}}}}</script><style>.temperature, .conditioner {margin: 0;padding: 30px 0 0 0;}.history {border-collapse: collapse;width: 100%;}.history td {padding: 0;vertical-align: bottom;}.history td.spark {line-height: 30px;}.history td.value {font-size: 1.6em;font-weight: normal;line-height: 50px;}.history td.value span {font-size: .5em;vertical-align: top;line-height: 40px;}.stats {text-align: center;}.pie-list {margin: 0;padding: 0;list-style-type: none;}.pie-list li {display: inline-block;text-align: center;width: 34px;font-size: 12px;}#stats-mon,#stats-tue,#stats-wed,#stats-thu,#stats-fri,#stats-sat,#stats-sun {display: block;width: 40px;line-height: 35px;}#temp-range {width: 100%;line-height: 40px;}</style>
第二条路线使用Kendo UI Sparkline组件描绘气候条件,将所有内容捆绑在一起,您现在可以使用以下命令在开发服务器中运行该应用程序:
npm run serve
您将拥有一个具有路由功能和所有预定义图表功能完善的UI组件。
结论
这篇文章介绍了针对Vue.js的Kendo UI,以及如何使用Kendo UI模板向导轻松启动Vue项目。 它还显示了实现Vue路由并将Kendo UI组件引入Vue项目是多么轻松。

标签:
声明:本站部分文章及图片源自用户投稿,如本站任何资料有侵权请您尽早请联系jinwei@zod.com.cn进行处理,非常感谢!