【下载TeeChart Pro ActiveX最新版本】
(一)填充新数据系列
1.1 ADO


从“Data Source”页面的下拉列表框中 选择“Dataset”,然后选择“New…”按钮以定义连接源。
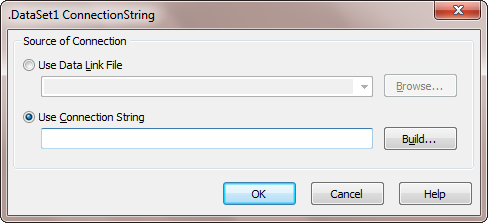
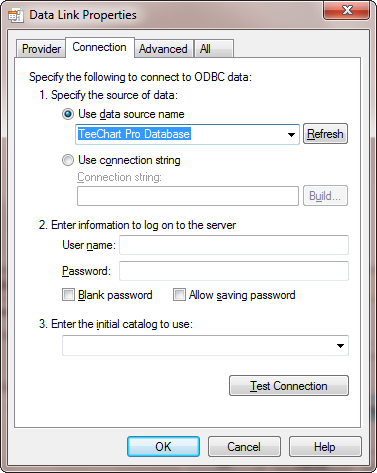
使用默认的Microsoft OLE DB Provider for ODBC Drivers Provider 构建新的连接字符串使您可以从任何具有有效用户DSN的ODBC数据源中进行选择,包括TeeChart Pro数据库。
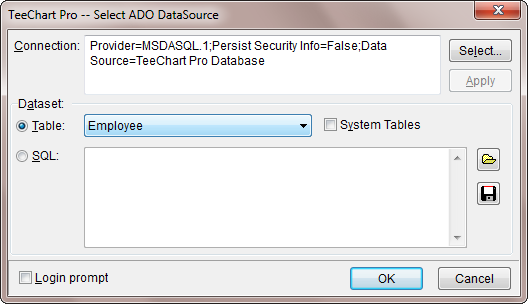
您可以从可用的表列表中选择一个表,也可以为数据源编写自己的SQL查询。SQL查询可以保存为TXT文件并以此形式引入。
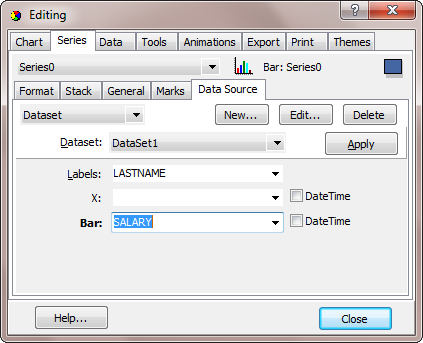
选择确定将创建整个连接操作的记录,在本例中称为DataSet1,并返回到先前的数据源屏幕,您可以在其中选择要添加到系列的列。要填充我们的新Bar系列,我们只需要标签和条形值,其中标签将在水平(默认情况下为底部)轴上读取,其中Bar是条形图垂直高度的值。完成这些字段后,您可以选择“ 关闭”或“ 应用”,您应该会看到已使用数据源中的数据填充图表。
1.2 编码数据输入
对于编程的数据输入,您需要编写一些代码。本节将向您展示使用编码输入构建图表所需的步骤。
With TChart1.Series(0) .Add 3, "Pears", vbRed .Add 4, "Apples", vbBlue .Add 2, "Oranges", vbGreenEnd With
运行项目并按下命令按钮。您的图表上将显示三个新栏。 图表中的第一个系列具有(0)索引,第二个(1)等。因此,在图表中有多个系列,您可以使用索引选择要修改的系列。 Series’Add方法接受3个变量,Value,Label和Color。因此,Add方法假设Label轴上的值间隔相等(在本例中为X轴)。如果您的数据包含2个变量,则可以使用AddXY方法。向项目添加另一个Command按钮并将此代码放入其中。运行项目并使用以下代码添加点:
With TChart1.Series(0) If .Count > 0 Then 'Increment X Axis value and add a new random point .AddXY .XValues.Last+(Rnd(100)), (.YValues.Last/.YValues.Last-1)+(Rnd(100)), "", vbBlue Else 'Add a new random point .AddXY 1, (Rnd(100)), "", vbBlue End If End With
(二)选择系列类型以满足您的需求
|
系列类型 |
变量数量 | 数据源属性 |
|
Standard |
||
|
Gantt |
3 |
StartValues, EndValues, AY (Y axis level), AXLabel (Label optionally shown on Y-axis or as mark) |
|
Line |
2 |
XValues, YValues, XLabel |
|
Bar |
2 |
XValues, YValues (called Bar), XLabel |
|
HorizBar |
2 |
XValues, YValues (called Bar), XLabel |
|
Area |
2 |
XValues, YValues, XLabel |
|
Point |
2 |
Xvalues, YValues, XLabel |
|
Pie |
1 |
PieValues, XLabel |
|
Fast Line |
2 |
XValues, YValues, XLabel |
|
HorizLine |
2 |
XValues, YValues, YLabel |
|
HorizArea |
2 |
XValues, YValues, YLabel |
|
Shape |
4 |
X0 (Top), Y0 (Bottom), X1 (Left), Y1 (Right) |
|
Bubble |
3 |
XValues, YValues, XLabel, RadiusValues |
|
3D |
||
|
Surface |
3 |
XValues, YValues, XLabel, ZValues |
|
Contour |
3 |
XValues, YValues, XLabel, ZValues |
|
Waterfall |
3 |
XValues, YValues, XLabel, ZValues |
|
Color Grid |
3 |
XValues, YValues, XLabel, ZValues |
|
Vector 3D |
3 |
XValues, YValues, XLabel, ZValues |
|
Tower |
3 |
XValues, YValues, XLabel, ZValues |
|
Iso-Surface |
3 |
XValues, YValues, XLabel, ZValues |
|
Point3D |
3 |
XValues, YValues, XLabel, ZValues |
|
Bubble |
5 |
XValues, YValues, XLabel, RadiusValues, ZValues |
|
Triangle Surf. |
3 |
XValues, YValues, XLabel, ZValues |
|
Polar Grid |
3 |
XValues, YValues, XLabel, (Polar Grid has Sectors, Tracks and Values) |
|
Extended |
||
|
Arrow |
4 |
StartXValues, StartYValues, XLabel, EndXValues, EndYValues |
|
Polar |
2 |
XValues, YValues, Labels (Polar has Angle and Radius) |
|
Radar |
2 |
XValues, YValues, Labels (Radar has Angle and Radius) |
|
Polar Bar |
3 |
XValues, YValues, Labels (Polar has Angle and Radius) |
|
Bezier |
2 |
XValues, YValues, XLabel |
|
Donut |
2 |
Angle, YValues, Labels |
|
Smith |
2 |
Resistance, Reactance, Labels |
|
Pyramid |
2 |
XValues, YValues, XLabels |
|
Map |
3 |
XValues, YValues, Polygons, Labels |
|
Org Chart |
2 |
XValues, YValues, Labels |
|
Tree Map |
2 |
XValues, YValues, Labels |
|
Financial |
||
|
Point & Figure |
5 |
OpenValues, CloseValues, HighValues, LowValues, DateValues |
|
Candle |
5 |
OpenValues, CloseValues, HighValues, LowValues, DateValues |
|
Volume |
2 |
XValues, YValues (VolumeValues), XLabel |
|
Darvas |
5 |
OpenValues, CloseValues, HighValues, LowValues, DateValues |
|
Renko |
2 |
XValues, YValues, Labels |
|
Kagi |
2 |
XValues, YValues, Labels |
|
Stats |
||
|
Histogram |
2 |
XValues, YValues, XLabel |
|
Horizontal Histogram |
2 |
XValues, YValues, XLabel |
|
Error Bar |
3 |
XValues, YValues, XLabel, ErrorValues |
|
Error |
3 |
XValues, YValues, XLabel, StdErrorValues |
|
High-Low |
3 |
XValues, YValues, LowValues, XLabel |
|
BoxPlot |
2 |
XValues, SamplesValues, Label |
|
Horizontal BoxPlot |
2 |
XValues, SamplesValues, Label |
|
Volume Pipe |
3 |
XValues, YValues, Labels |
|
Funnel |
3 |
XValues, QuoteValues, OpportunityValues, XLabel |
|
HighLow Line |
3 |
XValues, HighValues, LowValues, Labels |
|
Ternary |
5 |
XValues, YValues, ZValues, RadiusValues, WeightingValues, Labels |
|
Error Point |
6 |
XValues, YValues, LeftError, RightError, TopError, BottomError, Labels |
|
Error Point 3D |
9 |
XValues, YValues, ZValues, LeftError, RightError, TopError, BottomError, FrontError, BackError, Labels |
|
Other |
||
|
Line Point |
2 |
XValues, YValues, XLabel |
|
Bar Join |
2 |
XValues, YValues, XLabel |
|
Bar 3D |
3 |
XValues, YValues, YStartPoint, XLabel |
|
Big Candle |
5 |
OpenValues, CloseValues, HighValues, LowValues, DateValues |
|
Image Bar |
2 |
XValues, YValues, XLabel |
|
ImagePoint |
2 |
XValues, YValues, XLabel |
|
DeltaPoint |
2 |
XValues, YValues, XLabel |
|
Wind Rose |
2 |
Angle, YValues, Labels |
|
Clock |
2 |
Angle, YValues, Labels |
|
Rose |
3 |
Angle, YValues, Angle Values, Labels |
|
Calender |
2 |
XValues, YValues, Labels |
|
Tag Cloud |
2 |
YValues, ZValues, Labels |
|
Gauges |
||
|
Gauge |
1 |
YValue |
|
Numerical Gauge |
1 |
YValue |
|
Linear Gauge |
1 |
YValue |
|
Vertical |
1 |
YValue |
|
Circular gauge |
1 |
YValue |
|
Knob Gauge |
1 |
YValue |
购买TeeChart Pro AciveX正版授权,请点击“咨询在线客服”哟!

标签:图表图表库ActiveX图表解决方案图表控件teechart
声明:本站部分文章及图片源自用户投稿,如本站任何资料有侵权请您尽早请联系jinwei@zod.com.cn进行处理,非常感谢!