【下载TeeChart.Net最新版本】
(一)介绍
本教程重点介绍TeeChart for.NetTools,这是一个易于实现的代码单元,用户可以使用这些代码为TeeCharts添加额外的功能,有十种新工具可供部署:
(二)系列工具
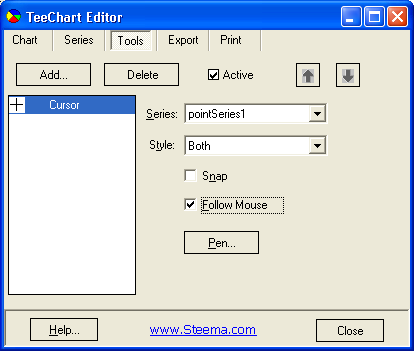
2.1 光标工具
光标工具将光标添加到图表中,该图表可以与单个系列或整个图表相关联。游标可以是水平的,垂直的或两者(十字准线)。
设计时:

运行时:
在运行时添加光标工具如下例所示:
[C#]
Points pointSeries1 = new Points(tChart1.Chart);CursorTool cursorTool1 = new CursorTool(tChart1.Chart);pointSeries1.FillSampleValues(20);cursorTool1.Active = true;cursorTool1.FollowMouse = true;cursorTool1.Series = pointSeries1;cursorTool1.Style = CursorToolStyles.Both;
[VB.Net]
Dim PointSeries1 As New Steema.TeeChart.Styles.Points(TChart1.Chart)Dim CursorTool1 As New Steema.TeeChart.Tools.CursorTool(TChart1.Chart)PointSeries1.FillSampleValues(20)CursorTool1.Active = TrueCursorTool1.FollowMouse = TrueCursorTool1.Series = PointSeries1CursorTool1.Style = Steema.TeeChart.Tools.CursorToolStyles.Both
2.2 拖动标记工具
拖动标记工具允许鼠标拖动所选系列的标记。
设计时:
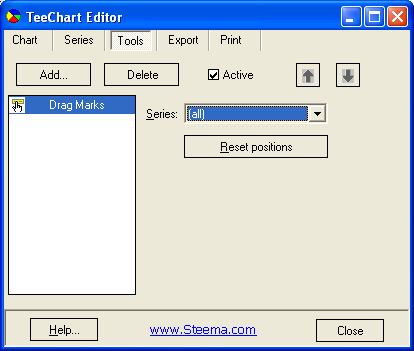
拖动标记工具可以设置为特定系列,也可以与所有图表系列保持关联,重置位置将所有移动的标记返回到其原始默认位置。
运行时:
在运行时添加拖动标记工具如下例所示:
[C#]
Bar bar1 = new Bar(tChart1.Chart);DragMarks dragMarks1 = new DragMarks(tChart1.Chart);bar1.FillSampleValues(20);dragMarks1.Active = true;dragMarks1.Series = bar1;
[VB.Net]
Dim Bar1 As New Steema.TeeChart.Styles.Bar(TChart1.Chart)Dim DragMarks1 As New Steema.TeeChart.DragMarks(TChart1.Chart)Bar1.FillSampleValues(20)DragMarks1.Active = TrueDragMarks1.Series = Bar1
2.3 拖动工具
拖动工具允许鼠标拖动所选系列的标记。
设计时:
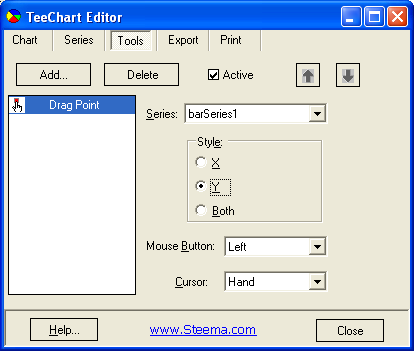
拖动工具可以设置为特定系列,也可以与所有图表系列保持关联,样式使拖动点工具能够拖动X方向,Y方向或两个方向的点,鼠标按钮选择活动鼠标按钮,而光标选择拖动系列点时显示的光标样式。
运行时:
在运行时添加拖动工具如下例所示:
[C#]
Bar bar1 = new Bar(tChart1.Chart);DragPoint dragPoint1 = new DragPoint(tChart1.Chart);bar1.FillSampleValues(10);dragPoint1.Active = true;dragPoint1.Series = bar1;dragPoint1.Style = DragPointStyles.Y;
[VB.Net]
Dim Bar1 As New Steema.TeeChart.Styles.Bar(TChart1.Chart)Dim DragPoint1 As New Steema.TeeChart.DragPoint(TChart1.Chart)Bar1.FillSampleValues(10)DragPoint1.Active = TrueDragPoint1.Series = Bar1DragPoint1.Style = Steema.TeeChart.DragPointStyles.Y
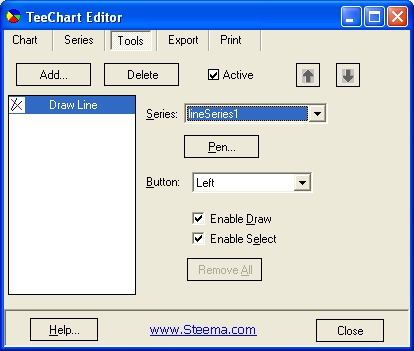
2.4 绘制线工具
绘制线工具可以使用鼠标在图表上绘制,选择,拖动和删除完全可自定义的线。
设计时:
运行时:
在运行时添加绘制工具如下例所示:
[C#]
Bar bar1 = new Bar(tChart1.Chart);DrawLine drawLine1 = new DrawLine(tChart1.Chart);bar1.FillSampleValues(20);drawLine1.Series = bar1;drawLine1.Button = MouseButtons.Left;drawLine1.EnableDraw = true;drawLine1.EnableSelect = true;drawLine1.Pen.Color = Color.AliceBlue;
[VB.Net]
Dim Bar1 As New Steema.TeeChart.Styles.Bar(TChart1.Chart)Dim DrawLine1 As New Steema.TeeChart.DrawLine(TChart1.Chart)Bar1.FillSampleValues(20)DrawLine1.Series = Bar1DrawLine1.Button = MouseButtons.LeftDrawLine1.EnableDraw = TrueDrawLine1.EnableSelect = TrueDrawLine1.Pen.Color = Color.AliceBlue
2.5 甘特图拖动工具
甘特图拖动工具可以拖动和/或调整甘特图系列的尺寸。
设计时:
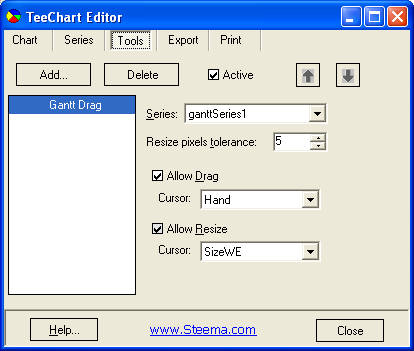
甘特拖曳工具必须与特定的甘特系列相关联。“Resize Pixel Tolerance调整像素容差”指定拖动的精确度,“Allow Drag允许拖动”启用拖动,而“Cursor光标”指定拖动时显示的光标。允许调整大小使Gantt Bar调整大小,而Cursor指定调整大小时显示的光标。
运行时:
在运行时添加甘特图拖动工具如下例所示:
[C#]
GanttSeries ganttSeries1 = new GanttSeries(tChart1.Chart);GanttTool ganttTool1 = new GanttTool(tChart1.Chart);ganttSeries1.FillSampleValues(10);ganttTool1.AllowResize = false;ganttTool1.AllowDrag = true;ganttTool1.MinPixels = 3;ganttTool1.Series = ganttSeries1;ganttTool1.Active = true;tChart1.Legend.Visible = false;
[VB.Net]
Dim GanttSeries1 As New Steema.TeeChart.GanttSeries(TChart1.Chart)Dim GanttTool1 As New Steema.TeeChart.GanttTool(TChart1.Chart)GanttSeries1.FillSampleValues(10)GanttTool1.AllowResize = FalseGanttTool1.AllowDrag = TrueGanttTool1.MinPixels = 3GanttTool1.Series = GanttSeries1GanttTool1.Active = TrueTChart1.Legend.Visible = False
2.6 图像工具
图像工具在指定的图表系列后面绘制图片(位图,jpeg,gif,png,pcx)。
设计时:
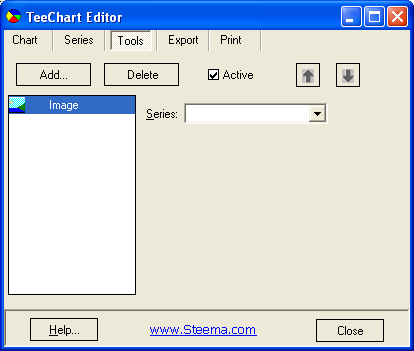
图像工具可以与特定系列相关联,也可以保留默认情况下与任何图表系列无关,使用Image one可以浏览或清除所有格式的图像。
运行时:
在运行时添加图像工具如下例所示:
[C#]
Bar bar1 = new Bar(tChart1.Chart);ChartImage chartImage1 = new ChartImage(tChart1.Chart);string imagePath = @"C:.bmp";Bitmap myBitMap = new Bitmap(imagePath);bar1.FillSampleValues(20);chartImage1.Active = true;chartImage1.Image = myBitMap;
[VB.Net]
Dim Bar1 As New Steema.TeeChart.Styles.Bar(TChart1.Chart)Dim ChartImage1 As New Steema.TeeChart.ChartImage(TChart1.Chart)Dim ImagePath As String = "C:.bmp"Dim MyBitMap As New Bitmap(ImagePath)Bar1.FillSampleValues(20)ChartImage1.Active = TrueChartImage1.Image = MyBitMap
2.7 标记提示工具
标记提示工具用于在鼠标悬停(或单击)系列点时显示默认提示窗口。
设计时:
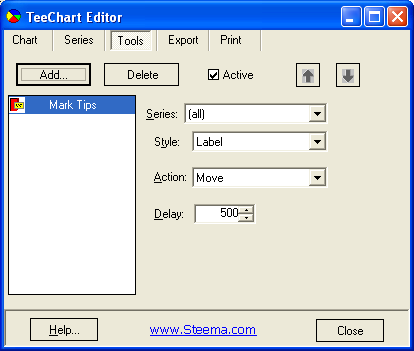
标记提示工具可以与特定系列相关联,也可以保留默认情况下与任何图表系列无关,样式定义要在“Mark Tips标记提示”中显示的系列数据的类型,而“Mouse Action鼠标操作”设置鼠标单击或移动时是否显示“Mark Tips标记提示”,延迟定义标记提示出现之前的时间间隔(以毫秒为单位)。
运行时:
在运行时添加标记提示工具如下例所示:
[C#]
PointSeries pointSeries1 = new PointSeries(tChart1.Chart);MarksTip marksTip1 = new MarksTip(tChart1.Chart); tabpointSeries1.FillSampleValues(20);marksTip1.Active = true;marksTip1.MouseDelay = 500;marksTip1.MouseAction = MarksTipMouseAction.Move;marksTip1.Style = MarksStyles.XY;
[VB.Net]
Dim PointSeries1 As New Steema.TeeChart.PointSeries(TChart1.Chart)Dim MarksTip1 As New Steema.TeeChart.MarksTip(TChart1.Chart)PointSeries1.FillSampleValues(20)MarksTip1.Active = TrueMarksTip1.MouseDelay = 500MarksTip1.MouseAction = Steema.TeeChart.MarksTipMouseAction.MoveMarksTip1.Style = Steema.TeeChart.MarksStyles.XY
2.8 最近点工具
最近点工具将标记移动到最靠近光标的点,该工具可以与系列关联或全局应用于图表。
设计时:
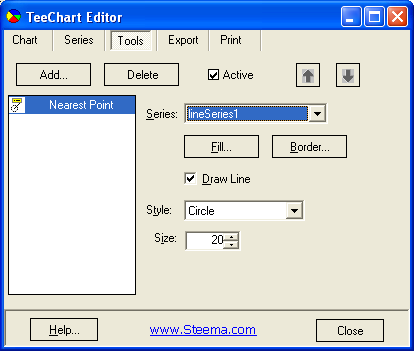
最近点工具需要与特定的图表系列相关联,它的外观可以使用Fill(Hatch Brush Editor)配置来定义最近点工具的主体,它的颜色,透明度,可见性,填充样式,填充渐变或填充图像和边框(Pen Editor)来定义样式最近点工具边框笔的颜色,宽度,结束,透明度和可见性,“Draw Line绘制线”启用/禁用光标位置和“Nearest Point Tool最近点工具”形状之间连接线的绘制,“Size大小”定义此形状的大小,而“Style样式”定义使用的形状类型。
运行时:
在运行时添加最近点工具如下例所示:
[C#]
Line line1 = new Line(tChart1.Chart);NearestPoint nearestPoint1 = new NearestPoint(tChart1.Chart);line1.FillSampleValues(20);nearestPoint1.Series = line1;nearestPoint1.Pen.Color = Color.Blue;nearestPoint1.Size = 25;nearestPoint1.Style = NearestPointStyles.Diamond;
[VB.Net]
Dim Line1 As New Steema.TeeChart.Styles.Line(TChart1.Chart)Dim NearestPoint1 As New Steema.TeeChart.NearestPoint(TChart1.Chart)Line1.FillSampleValues(20)NearestPoint1.Series = Line1NearestPoint1.Pen.Color = Color.BlueNearestPoint1.Size = 25NearestPoint1.Style = Steema.TeeChart.NearestPointStyles.Diamond
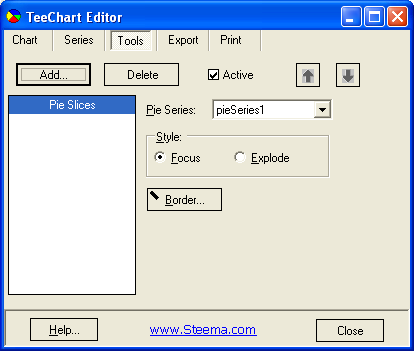
2.9 Pie Slices工具
Pie SlicesTool通过在其周围绘制边框或通过将其从Pie系列的其余部分展开来突出显示鼠标下的饼图切片。
设计时:
运行时:
在运行时添加Pie Slices工具如下例所示:
[C#]
PieSeries pieSeries1 = new PieSeries(tChart1.Chart);PieTool pieTool1 = new PieTool(tChart1.Chart);pieSeries1.FillSampleValues(10);pieTool1.Series = pieSeries1;pieTool1.Style = PieToolStyle.Explode;
[VB.Net]
Dim PieSeries1 As New Steema.TeeChart.PieSeries(TChart1.Chart)Dim PieTool1 As New Steema.TeeChart.PieTool(TChart1.Chart)PieSeries1.FillSampleValues(10)PieTool1.Series = PieSeries1PieTool1.Style = Steema.TeeChart.PieToolStyle.Explode
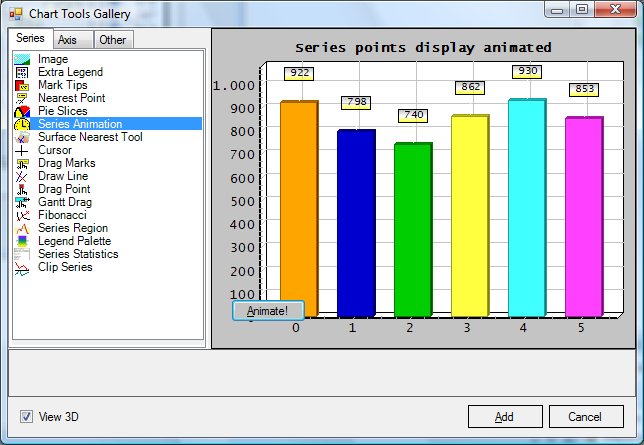
2.10 系列动画工具
系列动画工具执行系列点的增长动画。
设计时:
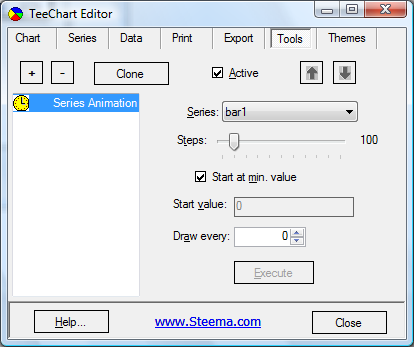
系列动画工具必须与一系列相关联才能运行,动画的速度由步骤轨迹栏和绘制每个属性控制,而动画的起点由系列最小值或起始值文本框定义。
运行时:
在运行时添加系列动画工具如下例所示:
[C#]
private SeriesAnimation tool;private void InitializeChart() Bar bar = new Bar(tChart1.Chart); tool = new SeriesAnimation(tChart1.Chart); tool.Series = bar; bar.FillSampleValues();private void button1_Click(object sender, EventArgs e) tool.Execute();
[VB.Net]
Dim tool As SeriesAnimationPublic Sub InitializeChart() Dim bar As Bar = New Bar(TChart1.Chart) tool = New SeriesAnimation(TChart1.Chart) tool.Series = bar bar.FillSampleValues()End SubPrivate Sub Button1_Click(ByVal sender As System.Object, ByVal e As System.EventArgs) Handles Button1.Click tool.Execute()End Sub
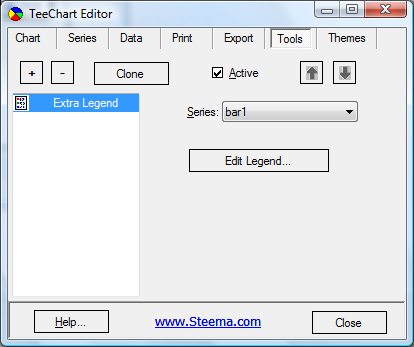
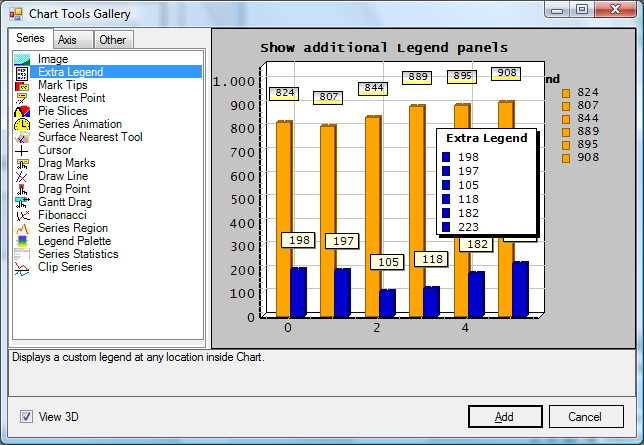
2.11 附加的图例工具
附加的图例工具在图表内的任何位置显示自定义图例。
设计时:
运行时:
在运行时添加附加图例工具如下例所示:
[C#]
Bar bar = new Bar(tChart1.Chart);ExtraLegend tool = new ExtraLegend(tChart1.Chart);tool.Series = bar;bar.FillSampleValues();
[VB.Net]
Dim bar As Bar = New Bar(TChart1.Chart)Dim tool As ExtraLegend = New ExtraLegend(TChart1.Chart)tool.Series = barbar.FillSampleValues()
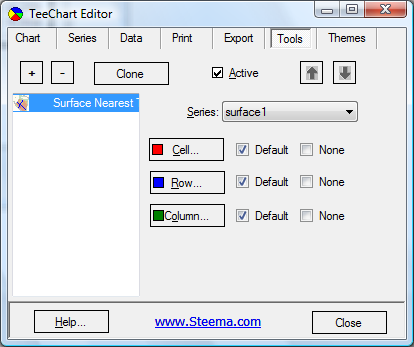
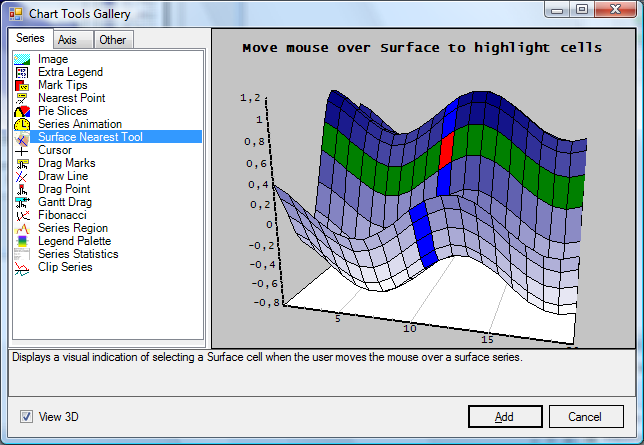
2.12 曲面最近工具
曲面最近工具显示当用户将鼠标移动到曲面系列上时选择曲面单元格的可视指示。
设计时:
运行时:
在运行时添加附加曲面最近工具如下例所示:
[C#]
Surface surface = new Surface(tChart1.Chart);SurfaceNearestTool tool = new SurfaceNearestTool(tChart1.Chart);tool.Series = surface;surface.FillSampleValues();
[VB.Net]
Dim surface As Surface = New Surface(TChart1.Chart)Dim tool As SurfaceNearestTool = New SurfaceNearestTool(TChart1.Chart)tool.Series = surfacesurface.FillSampleValues()
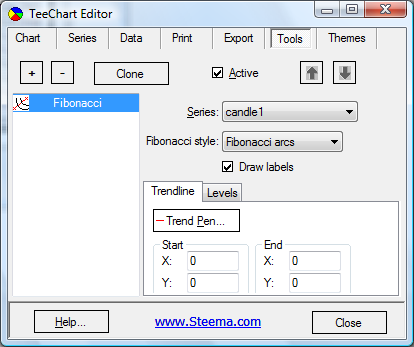
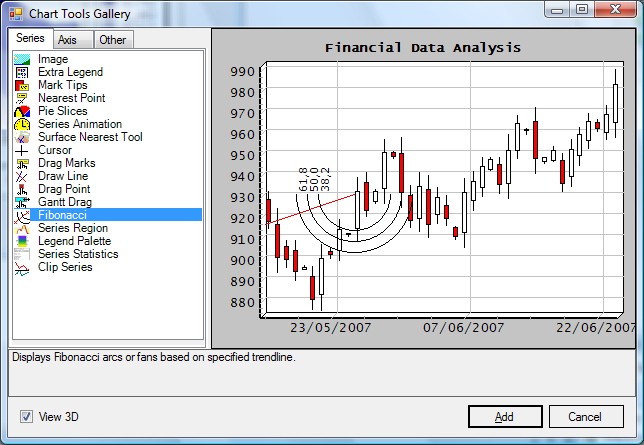
2.13 斐波纳契工具
斐波那契工具根据指定的趋势线显示斐波纳契弧或扇。
设计时:
运行时:
在运行时添加附加斐波纳契工具如下例所示:
[C#]
Candle candle = new Candle(tChart1.Chart);FibonacciTool tool = new FibonacciTool(tChart1.Chart);candle.FillSampleValues();tool.Series = candle;tool.StartX = candle.DateValues[0];tool.StartY = candle.CloseValues[0];tool.EndX = candle.DateValues[10];tool.EndY = candle.CloseValues[10];
[VB.Net]
Dim candle As Candle = New Candle(tChart1.Chart)Dim tool As FibonacciTool = New FibonacciTool(tChart1.Chart)candle.FillSampleValuestool.Series = candletool.StartX = candle.DateValues(0)tool.StartY = candle.CloseValues(0)tool.EndX = candle.DateValues(10)tool.EndY = candle.CloseValues(10)
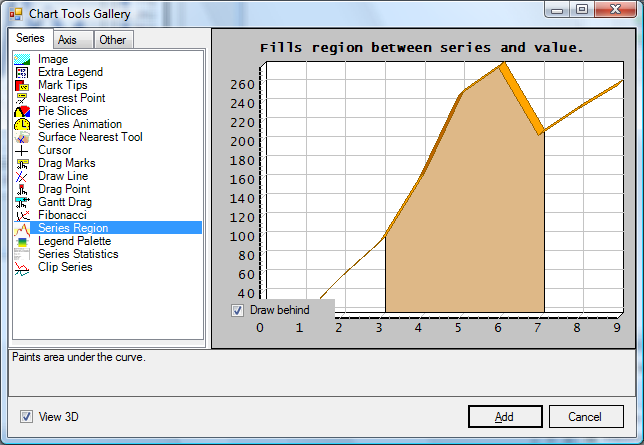
2.14 系列区域工具
系列区域工具绘制系列曲线下的区域。
设计时:
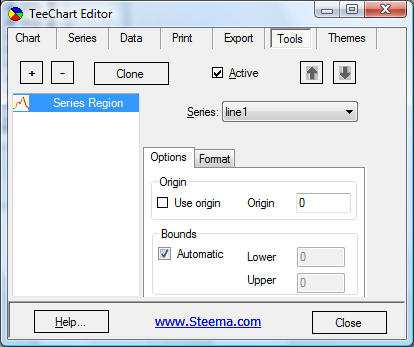
使用Series组合框选择要与工具关联的系列,Origin指定区域的yvalue(水平)基值,而Bounds指定xvalue(垂直)起点和终点限制。使用格式选项卡定义区域笔和画笔特征。
运行时:
在运行时添加附加系列区域工具如下例所示:
[C#]
Line line = new Line(tChart1.Chart);SeriesRegionTool tool = new SeriesRegionTool(tChart1.Chart);line.FillSampleValues();tool.Series = line;
[VB.Net]
Dim line As Line = New Line(TChart1.Chart)Dim tool As SeriesRegionTool = New SeriesRegionTool(TChart1.Chart)tool.Series = lineline.FillSampleValues()
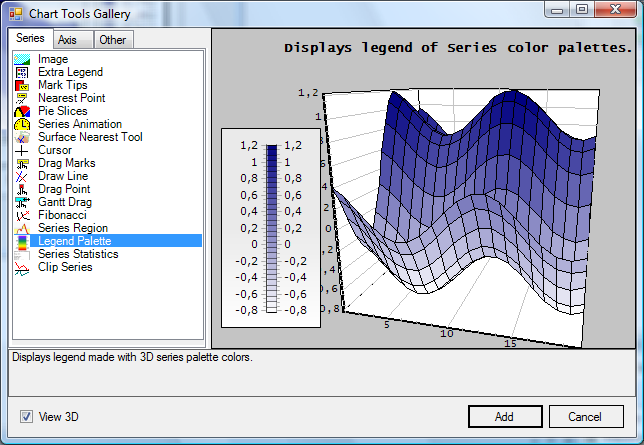
2.15 图例调色板工具
图例调色板工具显示使用3D系列调色板颜色制作的图例。
设计时:
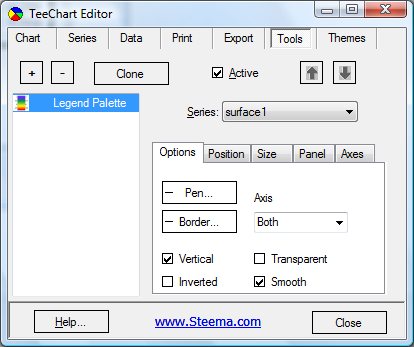
使用Series组合框选择要与工具关联的3D系列,该工具的所有元素都是完全可配置的。
运行时:
在运行时添加附加图例调色板工具如下例所示:
[C#]
Surface surface = new Surface(tChart1.Chart);LegendPalette tool = new LegendPalette(tChart1.Chart);surface.FillSampleValues();tool.Series = surface;
[VB.Net]
Dim surface As Surface = New Surface(TChart1.Chart)Dim tool As LegendPalette = New LegendPalette(TChart1.Chart)surface.FillSampleValues()tool.Series = surface
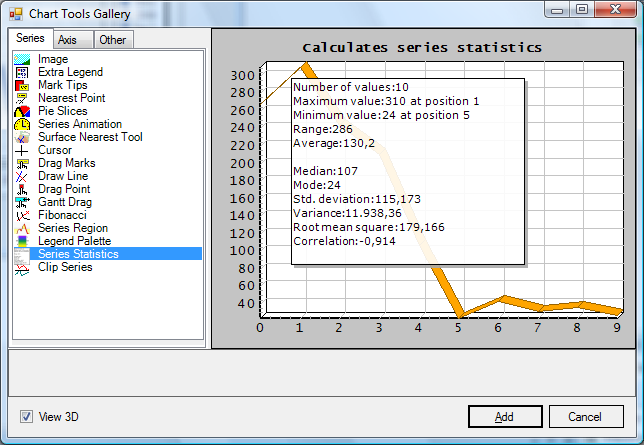
2.16 系列统计工具
系列统计工具计算给定系列的许多标准统计度量。
设计时:
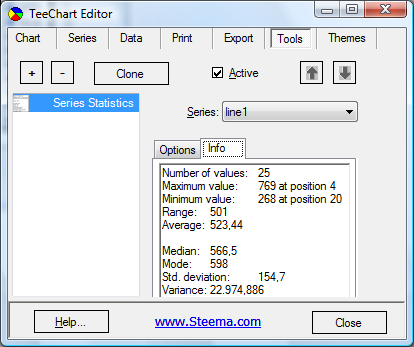
使用Series组合框选择要与工具关联的系列。
运行时:
在运行时添加系列统计工具如下例所示:
[C#]
SeriesStats tool = new SeriesStats(tChart1.Chart);Line line = new Line(tChart1.Chart);line.FillSampleValues();tool.Series = line;Annotation at = new Annotation(tChart1.Chart);at.Shape.Transparency = 10;at.Left = 80;at.Top = 50;at.Text = tool.Statistics;
[VB.Net]
Dim line As Line = New Line(TChart1.Chart)Dim tool As SeriesStats = New SeriesStats(TChart1.Chart)line.FillSampleValues()tool.Series = lineDim at As Annotation = New Annotation(TChart1.Chart)at.Shape.Transparency = 10at.Left = 80at.Top = 50at.Text = tool.Statistics
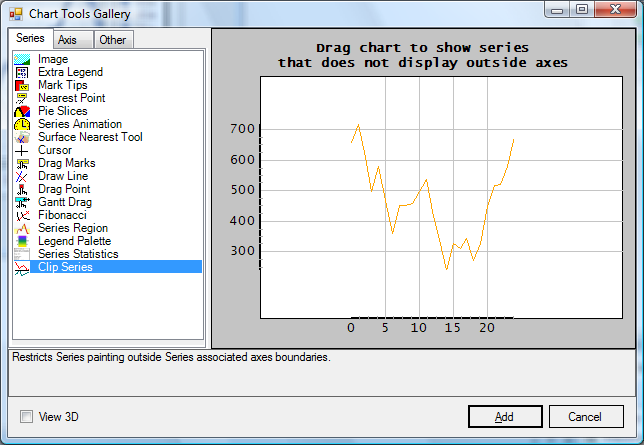
2.17 剪辑系列工具
剪辑系列工具限制系列关联轴边界外的系列绘制。
设计时:
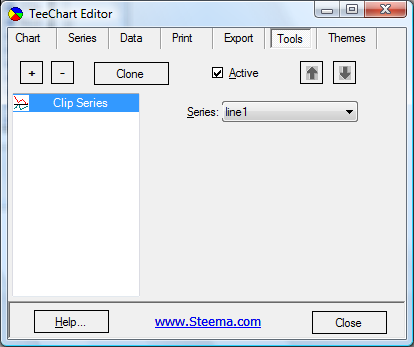
使用Series组合框选择要与工具关联的系列。
运行时:
在运行时添加剪辑系列工具如下例所示:
[C#]
Axis vert = new Axis(false, false, tChart1.Chart);Axis horiz = new Axis(true, false, tChart1.Chart);tChart1.Axes.Custom.Add(vert);tChart1.Axes.Custom.Add(horiz);Line line = new Line(tChart1.Chart);line.FillSampleValues();horiz.StartPosition = 20;horiz.EndPosition = 80;vert.StartPosition = 20;vert.EndPosition = 80;line.CustomHorizAxis = horiz;line.CustomVertAxis = vert;ClipSeries tool = new ClipSeries(tChart1.Chart);tool.Series = line;tChart1.Panel.MarginBottom = 10;tChart1.Panel.MarginLeft = 10;
[VB.Net]
Dim vert As Axis = New Axis(False, False, TChart1.Chart)Dim horiz As Axis = New Axis(True, False, TChart1.Chart)TChart1.Axes.Custom.Add(vert)TChart1.Axes.Custom.Add(horiz)Dim line As Line = New Line(TChart1.Chart)line.FillSampleValues()horiz.StartPosition = 20horiz.EndPosition = 80vert.StartPosition = 20vert.EndPosition = 80line.CustomHorizAxis = horizline.CustomVertAxis = vertDim tool As ClipSeries = New ClipSeries(TChart1.Chart)tool.Series = lineTChart1.Panel.MarginBottom = 10TChart1.Panel.MarginLeft = 10
标签:图表.NETteechart
声明:本站部分文章及图片源自用户投稿,如本站任何资料有侵权请您尽早请联系jinwei@zod.com.cn进行处理,非常感谢!